GALLUP NEWS SERVICE
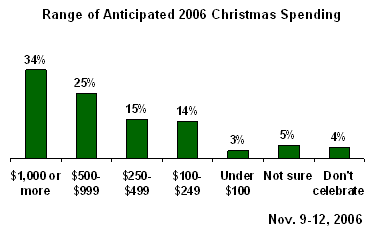
PRINCETON, NJ -- Gallup's latest forecast of Americans' 2006 holiday gift spending, its second this year, finds consumers planning to lay out more on Christmas gifts than what they have indicated in any previous early November poll dating back to 2000. According to the Nov. 9-12 poll, a third of adults nationwide (34%) think they will spend $1,000 or more on gifts. That is higher than the 25% to 30% Gallup recorded in early November surveys from 2002 to 2005. Consistent with this, the mean estimated expenditure today ($826) is Gallup's highest early November reading for this measure since 2000.
In addition to the highest spenders, one-quarter of Americans will spend between $500 and $999, 15% will spend between $250 and $499, and 17% will spend less than $250. Just 4% say they don't celebrate Christmas and won't be spending anything.
As noted, Americans estimate that their average Christmas gift bill in 2006 will be $826. (This includes those who won't be spending anything.) That average is slightly lower than the $907 average found last month, but is on the high end of the full range of responses recorded for this measure since 1999. More importantly, it is the highest estimate recorded in an early November survey since 2000, when the figure was a statistically similar $817.
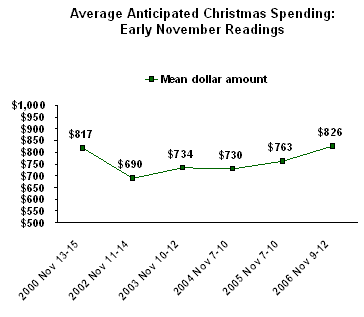
According to Gallup trends from previous years, Americans' Christmas spending intentions typically increase as the season progresses. In 2005, Gallup recorded an average estimated expenditure of $763 in November, but $840 in December. A similar pattern was seen in 2002, 2003, and 2004.
The decline from $907 last month to $826 today runs contrary to this pattern; however, because Gallup has asked this in October only once previously, it is unclear how to interpret this decline.
|
Monthly Trends in Christmas Spending Forecast
|
|||||
|
2002 |
2003 |
2004 |
2005 |
2006 |
|
|
$ |
$ |
$ |
$ |
$ |
|
|
October |
695 |
n/a |
n/a |
n/a |
907 |
|
Early November |
690 |
734 |
730 |
763 |
826 |
|
Late November/Early December |
753 |
776 |
862 |
840 |
-- |
Biggest Spenders
Christmas spending intentions vary greatly by household income. Americans living in households earning $75,000 or more per year plan to spend an average of $1,102 on Christmas gifts this season. This drops to $812 among middle-income earners, and to $512 among those earning less than $30,000.
|
2006 Christmas Spending Intentions, |
|
|
$75,000 |
$1,102 |
|
$30,000 to $74,999 |
$812 |
|
Less than $30,000 |
$512 |
Estimated Christmas spending is also higher among households with children younger than 18 living at home than among those without children at home: $1,020 versus $709.
Last month, Gallup found that men and women had about equal estimates of their Christmas spending. This month, men plan to spend an average of $929 while the average for women is significantly lower, at $728.
Although Christmas is among the holiest dates on the Christian calendar, there appears to be no relationship between one's depth of religious commitment and one's Christmas budget. In fact, less religious Americans may spend more on Christmas gifts than do active practitioners. Those who seldom or never attend their church or place of worship say they will spend an estimated average of $853 on gifts this year, compared with just over $800 for those who worship either weekly or nearly weekly.
Most Say Their Spending Is Stable
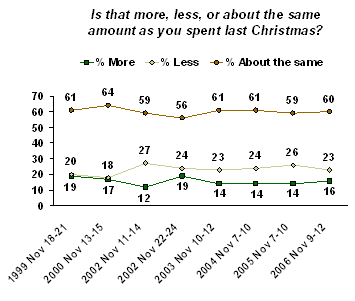
In addition to the dollar estimate, Gallup asks respondents to gauge whether their current year's Christmas gift giving is likely to cost more, less, or the same as the previous year's. Most Americans typically perceive that their spending will be about the same; among the rest, a higher proportion tend to say they will be spending less rather than more. That pattern holds true today: 60% think they will spend about the same this year as they did last Christmas, 16% say they will spend more, and 23% say they will spend less.
Survey Methods
Results are based on telephone interviews with 1,004 national adults, aged 18 and older, conducted Nov. 9-12, 2006. For results based on the total sample of national adults, one can say with 95% confidence that the maximum margin of sampling error is ±3 percentage points. In addition to sampling error, question wording and practical difficulties in conducting surveys can introduce error or bias into the findings of public opinion polls.
48. [Looking ahead for a moment to the Christmas holiday season,] roughly how much money do you think you personally will spend on Christmas gifts this year?
Trends for Comparison:
|
|
≥ |
$500- |
$250- |
$100- |
< |
NO‡ |
Median |
Mean |
Mean |
|
% |
% |
% |
% |
% |
% |
|
|
|
|
|
2006 Nov 9-12 |
34 |
25 |
15 |
14 |
3 |
9 |
$500 |
$826 |
$865 |
|
2005 Nov 7-10 |
30 |
26 |
13 |
16 |
3 |
12 |
$500 |
$763 |
$816 |
|
2004 Nov 7-10 |
29 |
25 |
16 |
17 |
2 |
11 |
$500 |
$730 |
$778 |
|
2003 Nov 10-12 |
30 |
25 |
18 |
14 |
3 |
10 |
$500 |
$734 |
$773 |
|
2002 Nov 11-14 |
25 |
27 |
18 |
14 |
3 |
13 |
$500 |
$690 |
$743 |
|
2000 Nov 13-15 |
33 |
28 |
15 |
13 |
2 |
9 |
$500 |
$817 |
$847 |
|
1999 Nov 18-21 |
35 |
27 |
14 |
13 |
6 |
5 |
$500 |
$857 |
$893 |
|
^ with zero |
|||||||||
|
^^ without zero |
|||||||||
|
‡ NO = No opinion |
|||||||||
Full Trend:
|
|
≥ |
$500- |
$250- |
$100- |
< |
NO‡ |
Median |
Mean |
Mean |
|
% |
% |
% |
% |
% |
% |
|
|
|
|
|
2006 Nov 9-12 |
34 |
25 |
15 |
14 |
3 |
9 |
$500 |
$826 |
$865 |
|
2006 Oct 9-12 |
34 |
24 |
13 |
13 |
6 |
10 |
$500 |
$907 |
$945 |
|
2005 Dec 5-8 |
33 |
27 |
14 |
12 |
3 |
11 |
$500 |
$840 |
$892 |
|
2005 Nov 7-10 |
30 |
26 |
13 |
16 |
3 |
12 |
$500 |
$763 |
$816 |
|
2004 Dec 5-8 |
33 |
24 |
17 |
11 |
3 |
12 |
$600 |
$862 |
$920 |
|
2004 Nov 7-10 |
29 |
25 |
16 |
17 |
2 |
11 |
$500 |
$730 |
$778 |
|
2003 Dec 11-14 |
31 |
28 |
18 |
13 |
3 |
7 |
$500 |
$776 |
$794 |
|
2003 Nov 10-12 |
30 |
25 |
18 |
14 |
3 |
10 |
$500 |
$734 |
$773 |
|
2002 Nov 22-24 |
30 |
30 |
15 |
15 |
3 |
7 |
$500 |
$753 |
$769 |
|
2002 Nov 11-14 |
25 |
27 |
18 |
14 |
3 |
13 |
$500 |
$690 |
$743 |
|
2002 Oct 14-17 |
25 |
26 |
16 |
14 |
2 |
17 |
$500 |
$695 |
$745 |
|
2001 Nov 26-27 |
32 |
30 |
15 |
13 |
2 |
9 |
$500 |
$794 |
$820 |
|
2000 Nov 13-15 |
33 |
28 |
15 |
13 |
2 |
9 |
$500 |
$817 |
$847 |
|
1999 Nov 18-21 |
35 |
27 |
14 |
13 |
6 |
5 |
$500 |
$857 |
$893 |
|
1998 Dec 4-6 |
24 |
25 |
22 |
14 |
8 |
7 |
-- |
-- |
-- |
|
1994 Dec 2-5 |
22 |
20 |
23 |
19 |
9 |
7 |
-- |
-- |
-- |
|
1993 Dec 4-6 |
19 |
27 |
20 |
17 |
8 |
9 |
-- |
-- |
-- |
|
1992 Dec 12-18 |
19 |
24 |
20 |
18 |
10 |
9 |
-- |
-- |
-- |
|
1991 Dec 12-15 |
20 |
24 |
22 |
19 |
7 |
8 |
-- |
-- |
-- |
|
1990 Nov 29-Dec 2 |
17 |
25 |
23 |
19 |
7 |
9 |
-- |
-- |
-- |
|
1989 Oct 12-15 |
18 |
23 |
25 |
15 |
4 |
15 |
-- |
-- |
-- |
|
|
|
|
|
|
|
|
|
|
|
|
^ with zero |
|||||||||
|
^^ without zero |
|||||||||
|
‡ NO = No opinion |
|||||||||
|
NOTE: No opinion includes those who do not celebrate Christmas |
|||||||||
49. Is that more, less, or about the same amount as you spent last Christmas?
|
|
|
|
About |
No |
|
% |
% |
% |
% |
|
|
2006 Nov 9-12 |
16 |
23 |
60 |
1 |
|
|
|
|
|
|
|
2006 Oct 9-12 |
12 |
18 |
67 |
3 |
|
2005 Dec 5-8 |
17 |
24 |
59 |
* |
|
2005 Nov 7-10 |
14 |
26 |
59 |
1 |
|
2004 Dec 5-8 |
16 |
23 |
59 |
2 |
|
2004 Nov 7-10 |
14 |
24 |
61 |
1 |
|
2003 Dec 11-14 |
19 |
21 |
58 |
2 |
|
2003 Nov 10-12 |
14 |
23 |
61 |
2 |
|
2002 Nov 22-24 |
19 |
24 |
56 |
1 |
|
2002 Nov 11-14 |
12 |
27 |
59 |
2 |
|
2002 Oct 14-17 |
12 |
22 |
64 |
2 |
|
2000 Nov 13-15 |
17 |
18 |
64 |
1 |
|
1999 Nov 18-21 |
19 |
20 |
61 |
* |
|
1998 Dec 4-6 |
19 |
21 |
60 |
* |
|
1994 Dec 2-5 |
18 |
20 |
62 |
0 |
|
1993 Dec 4-6 |
20 |
27 |
53 |
* |
|
1992 Dec 18-20 |
22 |
28 |
50 |
* |
|
1991 Dec 12-15 |
16 |
33 |
43 |
8 |
|
1990 Nov 29-Dec 2 |
15 |
26 |
57 |
2 |
|
* Less than 0.5% |
||||