GALLUP NEWS SERVICE
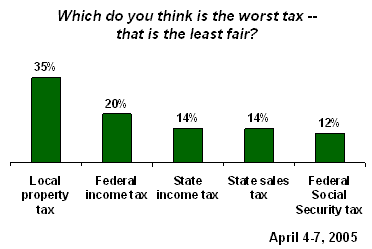
PRINCETON, NJ -- As the deadline nears for taxpayers to file their annual income tax returns, a new Gallup survey finds Americans expressing mixed feelings about the fairness of the tax. Most say upper-income people and corporations pay too little taxes and lower-income people pay too much, but most Americans say their own tax bill is fair. A slight majority also says federal income taxes are too high. The "worst," or "least fair," tax: the local property tax, followed by the federal income tax, with the Social Security tax, state income tax, and state sales tax tying for third.
The poll, conducted April 4-7, shows that 61% of Americans say the income tax they will have to pay this year is fair, while 34% say it is not.
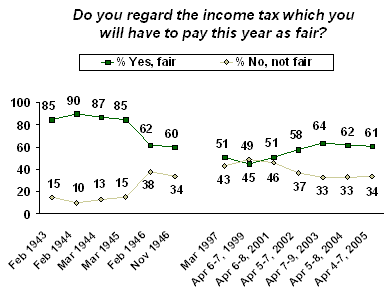
During World War II, from 1943 to 1945, Gallup found that more than 8 in 10 Americans said income taxes were fair, but in the immediate postwar period (1946), that number fell to about 6 in 10 Americans. When Gallup began asking the question again in 1997, the public was more evenly divided. After the 9/11 terrorist attacks, the percentage saying "fair" jumped to 58%, up from 51% the previous April. In April 2003, shortly after the Iraq war was launched, the percentage jumped even higher to 64%, about the level of the post-World War II sentiment.
The Iraq war and the war on terrorism followed major tax cuts passed by the Congress and signed by the president. Whether these tax cuts or U.S. involvement in war are more responsible for the change in opinion is impossible to determine. The fact that the percentage saying "fair" jumped in April 2003, however, suggests that wartime patriotism is a major, if not sole, influence.
While 61% of Americans say the federal income tax they have to pay is fair, 51% also say the amount they have to pay is too high. One might think that if people say their tax bill is fair, they wouldn't also say it is too high. But the poll shows that 29% of people who say their taxes are fair also say they have to pay too much.
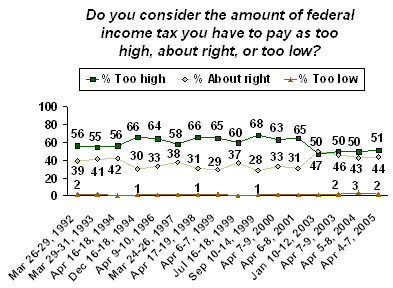
From the 1992 presidential campaign until the Republicans won majority control of the U.S. House of Representatives in 1994, just over a majority of Americans said they had to pay too much in taxes. Over the next seven years, as the Republicans pushed tax-cut legislation, an average of 64% of Americans expressed that view. In the first poll following the 9/11 terrorist attacks, the percentage complaining of excess taxation dropped dramatically -- just 47% said income taxes were too high, not much different from the 51% who express that sentiment in the current poll.
Again, one could attribute some of the change in opinion to the actual tax cuts that have passed during the Bush administration, though history suggests it is national security rather than tax cuts themselves that more significantly influence people's opinion on this issue. In March 1949, during the Berlin blockade that had been imposed by the Soviet Union in June of the previous year, the percentage saying taxes were too high dropped to 43% from 57% the previous March. The only other time in the post-World War II period that less than a majority of Americans complained of taxes that were too high occurred during the Berlin Crisis of 1958-1962. In three polls during that time, Gallup found an average of 48% saying taxes were too high. After the crisis appeared to be over, an early summer 1962 poll found 63% with that view, though there had been no significant increase in the tax rate.
Majority of Upper-Income People Say They Pay Too Little Taxes; Lower- and Middle-Income People Agree
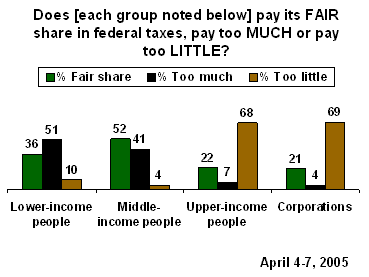
While most Americans say the amount of taxes they pay is fair, large majorities also say the amount corporations and upper-income people pay is too little, and a slight majority says the amount lower-income people pay is too much.
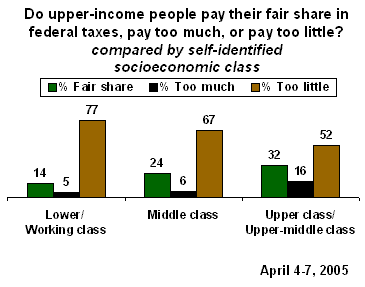
About 16% of all Americans identify themselves as either "upper class" or "upper middle class." A majority of this group, 52%, says upper-income people pay too little taxes. Among people who identify themselves as "working/lower class" or "middle class," large majorities agree -- 77% and 67%, respectively.
Recent news reports suggest that the federal government fails to collect up to $350 billion in taxes every year because people cheat on their returns. But this year, the Internal Revenue Service says it is making a special effort to go after corporations, upper-income people, and small businesses, to make sure the taxes are paid. The poll shows that Americans are divided over how difficult it is to cheat on income taxes. Thirty percent say it is becoming harder to do so, 21% say it is easier, and 35% say there has been no change.
Do you believe it is becoming -- [ROTATED: easier for someone to cheat on their income taxes, has there been no change, or is it becoming harder for someone to cheat on their income taxes]?
|
|
Easier |
No change |
Harder |
No opinion |
|
|
|
|
|
|
|
2005 Apr 4-7 |
21% |
35 |
30 |
14 |
Which is the worst tax people have to pay? The winner, as it was two years ago, is the property tax, followed by the federal income tax. Three other taxes essentially tie for third place -- state income tax, state sales tax, and the Social Security tax.
Survey Methods
Results in the current survey are based on telephone interviews with 1,010 national adults, aged 18 and older, conducted April 4-7, 2005. For results based on the total sample of national adults, one can say with 95% confidence that the maximum margin of sampling error is ±3 percentage points. For results based on the 503 national adults in the Form A half-sample and 507 national adults in the Form B half-sample, the maximum margins of sampling error are ±5 percentage points. In addition to sampling error, question wording and practical difficulties in conducting surveys can introduce error or bias into the findings of public opinion polls.
33. Do you consider the amount of federal income tax you have to pay as too high, about right, or too low?
34. Do you regard the income tax which you will have to pay this year as fair?
|
|
Yes, fair |
No, not fair |
No opinion |
|
% |
% |
% |
|
|
2005 Apr 4-7 |
61 |
34 |
5 |
|
|
|
|
|
|
2004 Apr 5-8 |
62 |
33 |
5 |
|
2003 Apr 7-9 |
64 |
33 |
3 |
|
2002 Apr 5-7 |
58 |
37 |
5 |
|
2001 Apr 6-8 |
51 |
46 |
3 |
|
1999 Apr 6-7 |
45 |
49 |
6 |
|
1997 Mar |
51 |
43 |
6 |
|
1946 Nov |
60 |
34 |
6 |
|
1946 Feb |
62 |
38 |
-- |
|
1945 Mar |
85 |
15 |
-- |
|
1944 Mar |
87 |
13 |
-- |
|
1944 Feb |
90 |
10 |
-- |
|
1943 Feb |
85 |
15 |
-- |
35. As I read off some different groups, please tell me if you think they are paying their FAIR share in federal taxes, paying too MUCH or paying too LITTLE? First, how about -- [ITEMS A-C ROTATED, ITEM D READ LAST]?
A. Lower-income people
|
|
Fair share |
Too much |
Too little |
No opinion |
|
% |
% |
% |
% |
|
|
2005 Apr 4-7 |
36 |
51 |
10 |
3 |
|
|
|
|
|
|
|
2004 Apr 5-8 |
35 |
49 |
12 |
4 |
|
2003 Apr 7-9 |
36 |
49 |
12 |
3 |
|
1999 Apr 6-7 |
34 |
51 |
11 |
4 |
|
1996 Apr 9-10 |
40 |
48 |
9 |
3 |
|
1994 Apr 16-18 |
43 |
42 |
12 |
3 |
|
1993 Mar 29-31 |
37 |
51 |
9 |
3 |
|
1992 Mar 26-29 |
32 |
57 |
8 |
3 |
B. Middle-income people
|
|
Fair share |
Too much |
Too little |
No opinion |
|
% |
% |
% |
% |
|
|
2005 Apr 4-7 |
52 |
41 |
4 |
3 |
|
|
|
|
|
|
|
2004 Apr 5-8 |
47 |
46 |
4 |
3 |
|
2003 Apr 7-9 |
51 |
40 |
7 |
2 |
|
1999 Apr 6-7 |
35 |
59 |
4 |
2 |
|
1996 Apr 9-10 |
34 |
58 |
5 |
3 |
|
1994 Apr 16-18 |
39 |
57 |
3 |
1 |
|
1993 Mar 29-31 |
39 |
54 |
5 |
2 |
|
1992 Mar 26-29 |
36 |
57 |
5 |
2 |
C. Upper-income people
|
|
Fair share |
Too much |
Too little |
No opinion |
|
% |
% |
% |
% |
|
|
2005 Apr 4-7 |
22 |
7 |
68 |
3 |
|
|
|
|
|
|
|
2004 Apr 5-8 |
24 |
9 |
63 |
4 |
|
2003 Apr 7-9 |
24 |
10 |
63 |
3 |
|
1999 Apr 6-7 |
19 |
10 |
66 |
5 |
|
1996 Apr 9-10 |
19 |
9 |
68 |
4 |
|
1994 Apr 16-18 |
20 |
10 |
68 |
2 |
|
1993 Mar 29-31 |
16 |
5 |
77 |
2 |
|
1992 Mar 26-29 |
16 |
4 |
77 |
3 |
D. Corporations
|
|
Fair share |
Too much |
Too little |
No opinion |
|
|
|
|
|
|
|
2005 Apr 4-7 |
21% |
4 |
69 |
6 |
|
|
|
|
|
|
|
2004 Apr 5-8 |
19% |
5 |
69 |
7 |
Q.36-37 SPLIT SAMPLED
36. Which do you think is the worst tax -- that is the least fair -- federal income tax, federal Social Security tax, state income tax, state sales tax, or local property tax?
BASED ON 503 NATIONAL ADULTS IN FORM A
|
|
Federal |
Federal |
State |
State |
Local |
No |
|
% |
% |
% |
% |
% |
% |
|
|
2005 Apr 4-7 ^ |
20 |
10 |
7 |
17 |
42 |
4 |
|
|
|
|
|
|
|
|
|
2003 Apr 7-9 |
21 |
11 |
11 |
13 |
38 |
6 |
|
1994 Jun 17-Jul 6 |
27 |
13 |
7 |
14 |
28 |
11 |
|
1992 Jun 23-28 |
25 |
10 |
9 |
16 |
25 |
15 |
|
1990 May 4-22 |
26 |
15 |
10 |
12 |
28 |
9 |
|
1989 Jun 9-22 |
21 |
18 |
9 |
14 |
28 |
10 |
|
1988 Jun 11-19 |
26 |
17 |
9 |
15 |
24 |
9 |
|
^ Asked of a half sample |
||||||
37. Which do you think is the worst tax--that is the least fair -- [ROTATED: federal income tax, federal Social Security tax, state income tax, state sales tax, (or) local property tax]?
BASED ON 507 NATIONAL ADULTS IN FORM B
|
|
Federal |
Federal |
State |
State |
Local |
No |
|
|
|
|
|
|
|
|
|
2005 Apr 4-7 ^ |
20% |
12 |
14 |
14 |
35 |
5 |
|
^ Asked of a half sample |
||||||
38. Do you believe it is becoming -- [ROTATED: easier for someone to cheat on their income taxes, has there been no change, or is it becoming harder for someone to cheat on their income taxes]?
|
|
Easier |
No change |
Harder |
No opinion |
|
|
|
|
|
|
|
2005 Apr 4-7 |
21% |
35 |
30 |
14 |

