PRINCETON, NJ -- Sixty percent of Americans say they favor the death penalty for convicted murderers, the lowest level of support Gallup has measured since November 1972, when 57% were in favor. Death penalty support peaked at 80% in 1994, but it has gradually declined since then.
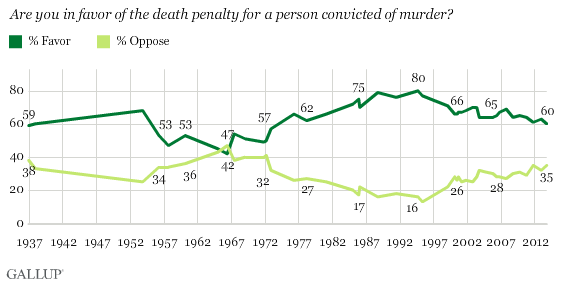
Gallup first asked Americans their views on the death penalty using this question in 1936, and has updated it periodically since then, including annual updates since 1999.
Americans have typically favored the death penalty; in fact, support has exceeded opposition in all but one survey, conducted in May 1966, during an era marked by philosophical and legal challenges to the death penalty from the mid-1950s through the early 1970s. Americans' support for the death penalty waned during that time. The culmination of that era was the Supreme Court's 1972 Furman v. Georgia decision, which invalidated all state death penalty statutes on technical grounds but stopped short of declaring the practice itself unconstitutional. Four years later, the court ruled that several newly written death penalty laws were constitutional, and executions resumed in the U.S. shortly thereafter.
From then until the mid-'90s, death penalty support climbed, reaching 80% in 1994, a year in which Americans consistently named crime as the most important problem facing the United States.
The current era of lower support may be tied to death penalty moratoriums in several states beginning around 2000 after several death-row inmates were later proven innocent of the crimes of which they were convicted. More recently, since 2006, six states have repealed death penalty laws outright, including Maryland this year.
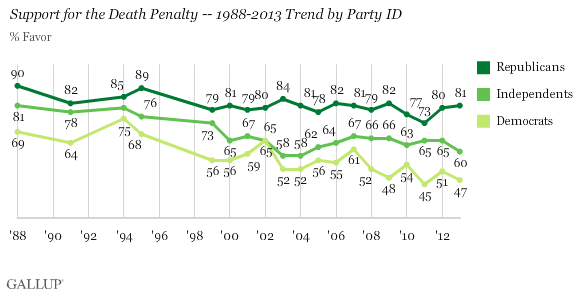
Democratic Support Down Nearly Thirty Points Since Peak
Politics is a major dividing line in Americans' death penalty views -- 81% of Republicans currently favor it, compared with 47% of Democrats. Independents' 60% support matches the national average.
Support among all three party groups has declined in the last 25 years, with the largest drop among Democrats. Democrats' level of support is currently down 28 percentage points from its 1994 peak and has fluctuated around the 50% mark for the last several years. Independents' support has generally been in the 60% range since 2000, but was consistently above 70% from the late 1980s through 1999. Republicans' support has averaged 80% since 2000, but averaged a higher 85% from 1988-1999.
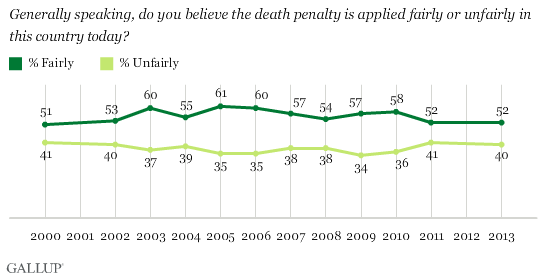
Slim Majority Say Death Penalty Applied Fairly
Fifty-two percent of Americans believe the death penalty is applied fairly in the United States -- a smaller figure than the 60% who favor the death penalty. Forty percent believe the death penalty is applied unfairly. Gallup first asked this question in 2000, when the Illinois moratorium on the death penalty made headlines. At that time, 51% said the death penalty was applied fairly, which remains the low point in the 14-year trend. In 2004, a high of 61% said the death penalty was applied fairly.
A separate question asking about the frequency of use of the death penalty finds 44% of Americans saying the death penalty in the U.S. is not imposed often enough -- rather than too often or the right amount of time. Americans have always been most likely to say the death penalty is not imposed often enough, consistent with their generally favoring the death penalty. However, the current percentage holding that view is among the lowest Gallup has measured.
Exactly half as many, 22%, believe the death penalty is imposed too often. Another 26% say the death penalty is used the right amount of time.
![Trend: In your opinion, is the death penalty imposed -- [ROTATED: too often, about the right amount, or not often enough]?](https://content.gallup.com/origin/gallupinc/GallupSpaces/Production/Cms/POLL/_qv7wx8dwkwsp4wr3_z7ra.png)
Implications
Gallup's nearly 80-year history of measuring death penalty attitudes shows that Americans generally favor the practice, but there have been distinct eras of higher or lower support. And state and federal laws, as well as legal rulings, have tended to move in concert with public opinion. Support is now the lowest in four decades, and a growing number of states have taken action to abolish the death penalty.
Currently, 18 states do not allow the death penalty, and six of those bans have occurred since 2006. Six others instituted bans during the mid-1950s through the early 1970s, when U.S. support for the death penalty was lowest historically.
It is unclear whether the Supreme Court might ever reconsider its decision on the constitutionality of state death penalty laws. Most of the recent death penalty rulings have centered more narrowly on the constitutionality of death sentences for juveniles and the mentally impaired. That includes a case in the current term that calls into question state guidelines for determining thresholds regarding whether a defendant is mentally impaired, and thus, whether he or she can be sentenced to death.
The recent change in death penalty attitudes could be specific to that issue, or it could be part of a broader shift to more politically liberal positions on social issues, including legal gay marriage and legal marijuana use.
Survey Methods
Results for this Gallup poll are based on telephone interviews conducted Oct. 3-6, 2013, with a random sample of 1,028 adults, aged 18 and older, living in all 50 U.S. states and the District of Columbia.
For results based on the total sample of national adults, one can say with 95% confidence that the margin of sampling error is ±4 percentage points.
Interviews are conducted with respondents on landline telephones and cellular phones, with interviews conducted in Spanish for respondents who are primarily Spanish-speaking. Each sample of national adults includes a minimum quota of 50% cellphone respondents and 50% landline respondents, with additional minimum quotas by region. Landline and cell telephone numbers are selected using random-digit-dial methods. Landline respondents are chosen at random within each household on the basis of which member had the most recent birthday.
Samples are weighted to correct for unequal selection probability, nonresponse, and double coverage of landline and cell users in the two sampling frames. They are also weighted to match the national demographics of gender, age, race, Hispanic ethnicity, education, region, population density, and phone status (cellphone only/landline only/both, and cellphone mostly). Demographic weighting targets are based on the March 2012 Current Population Survey figures for the aged 18 and older U.S. population. Phone status targets are based on the July-December 2011 National Health Interview Survey. Population density targets are based on the 2010 census. All reported margins of sampling error include the computed design effects for weighting.
In addition to sampling error, question wording and practical difficulties in conducting surveys can introduce error or bias into the findings of public opinion polls.
View methodology, full question results, and trend data.
For more details on Gallup's polling methodology, visit www.gallup.com.