

American Public Opinion About Retirement
Tuesday, June 21, 2005
by Joseph Carroll
Demographics of Retirement
Every month, Gallup asks Americans about their employment situations. A combined aggregate of the results since the start of the year, a collection of over 13,000 interviews, shows that roughly one in five Americans (21%) say they are retired. Nearly 6 in 10 Americans are employed full-time (51%) or part-time (8%), while 7% are homemakers, 5% are students, and 5% are unemployed.
What exactly is the composition of the retired population in America today?
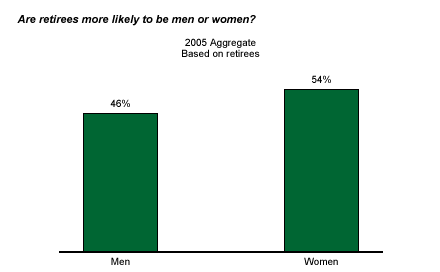
Gender. The aggregate data show that there are more women than men who say they are retired. Fifty-four percent of retirees are women, while 46% are men. This compares with the entire sample of U.S. adults across these surveys of 52% women and 48% men.
Age. The average age of retirees in the country today is 71. This includes 8% of retirees who are under age 55, 9% who are between the ages of 55 and 59, 16% who are in their 60s, 45% who are in their 70s, 20% who are in their 80s, and 2% who are older than that.
Party Affiliation. Retirees are slightly more likely to identify with the Democratic Party than with the Republican Party. According to the results, 39% of retirees say they are Democrats, while 34% are Republicans and 27% independents. Retirees also skew more toward the Democratic Party when compared with the national average across these 13 polls conducted since the start of the year. Among adults nationwide, 35% identify themselves as Republicans, 33% as Democrats, and 32% as independents.
Income. Retirees earn significantly less, on average, than do all Americans. Slightly less than half of retirees (47%) live in households earning less than $30,000 per year, while an additional 40% live in households earning between $30,000 and $74,999 per year. Only 11% earn $75,000 per year or more. These results compare with 28% of all U.S. adults who earn less than $30,000 per year, 45% who earn between $30,000 and $74,999 per year, and 26% who earn $75,000 or more annually.
Education. A slim majority of retired Americans, 52%, have only a high school education, while 26% have some college, 9% have graduated from college, and 13% have postgraduate education. This compares with 39% of all U.S. adults who have a high school education, 32% who have some college, 15% who are college graduates, and 15% who have postgraduate education.
Retirement Age
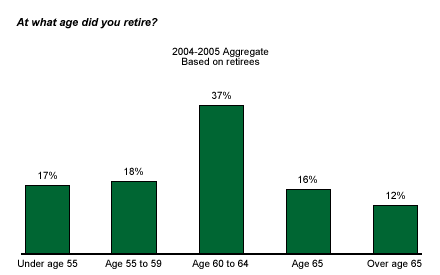
Gallup's annual survey on the Economy and Personal Finance, conducted every April, asks retirees several questions about their retirement, including sources of income and the age at which they left the workforce. The combined results of Gallup's 2004 and 2005 surveys show that the average retirement age is 60. This includes 17% who retired before age 55, 18% who retired between the ages of 55 and 59, 37% who retired between 60 and 64, and 16% who retired at 65. Only 12% retired later than that.
Sources of Income
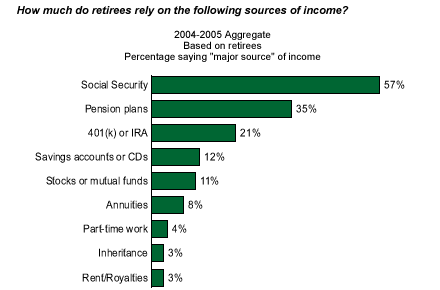
According the 2004-2005 aggregate, retirees are most likely to rely on Social Security as an important income source. A majority of retirees, 57%, say Social Security is a "major source" of household income. This is followed by work-sponsored pension plans (35% say these are major sources of income), 401(k)s or IRAs (21%), regular savings accounts or CDs (12%), and individual stocks or mutual funds (11%). Fewer than 1 in 10 retired Americans say annuities or insurance (8%), part-time work (4%), inheritance (3%), or rent and royalties (3%) are major sources of retirement income.