Roughly One-Third of Americans Satisfied With State of Nation
Tuesday, December 13, 2005
by Joseph Carroll
Every month, Gallup asks Americans whether they are satisfied or dissatisfied with "the way things are going in the United States at this time." The most recent results, taken from a Dec. 5-8 poll, find that 35% of Americans say they are satisfied, while a majority of U.S. adults, 62%, are dissatisfied.
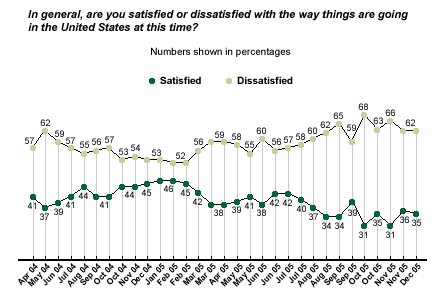
Earlier in the year, Gallup found satisfaction levels somewhat higher than they have been in recent months. Across 12 polls conducted from January through July, on average, 41% of adults expressed satisfaction, while 56% expressed dissatisfaction with the way things are going. In August, satisfaction dipped below 40%, and it has remained in the 30% range since then, reaching a low of 31% in mid-October and again in early November.
The current readings are below average for the 26-year period in which Gallup has been using this measure. Since 1979, the average percentage of Americans saying they are satisfied has been 44%, and the average dissatisfaction percentage has been 52%.
Satisfaction was highest in February 1999, when 71% of Americans said they were satisfied and 26% said they were dissatisfied. The low point for this measure came in July 1979 -- only 12% of Americans were satisfied at that time, while more than 8 in 10 adults (84%) were dissatisfied. Satisfaction was almost as low in June 1992, when only 14% were satisfied.
Republicans Much More Likely Than Democrats to Be Satisfied
The current poll finds that Republicans are substantially more likely than Democrats or independents to say they are satisfied with the way things are going at this time. More than 6 in 10 Republicans (61%) express satisfaction with the state of the nation, compared with 26% of independents, and just 13% of Democrats.
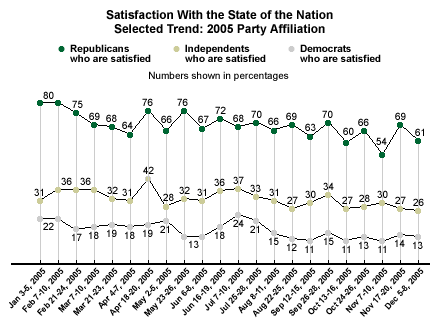
The vast partisan differences have existed throughout the year.
Republicans were most satisfied in January and early February, when 80% expressed this sentiment. Since then, the percentage of Republicans who say they are satisfied has averaged 67%, with a high of 76% and a low of 54%.
Since the beginning of the year, only about one in six Democrats, on average, have said they are satisfied with the way things are going. The high point among Democrats came in early July, when 24% said they were satisfied, and the low point came in mid-September, mid-October, and early November, when 11% in each of these surveys said they were satisfied.
Independents are more likely to be satisfied than are Democrats, but their overall satisfaction is considerably lower than Republicans’. On average, only 32% have expressed satisfaction since the start of the year, with a high of 42% and a low of 26%.
Satisfaction by Groups
The December poll also finds that some groups in the country are more likely to say they are satisfied than are others.
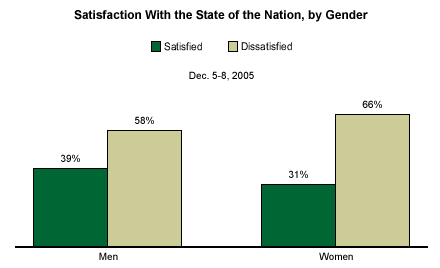
- By 39% to 31%, men are somewhat more likely than women to say they are satisfied.
- Nearly 4 in 10 whites (38%) say they are satisfied with the state of the nation, compared with only 22% of nonwhites
- Americans aged 30 to 49 are slightly more likely to be satisfied than Americans in other age groups. Thirty percent of 18- to 29-year-olds say they are satisfied, while 40% of 30- to 49-year-olds, 34% of 50- to 64-year-olds, and 27% of those aged 65 and older share that sentiment.
- There are only modest variations by region, with satisfaction ratings at 32% among Easterners, 39% among Midwesterners, 33% among Southerners, and 34% among Westerners.
- Only about one in four adults living in households earning less than $30,000 per year (26%) say they are satisfied. This compares with 34% of adults earning between $30,000 and $75,000 per year and 44% of those earning $75,000 or more per year.