GALLUP NEWS SERVICE
PRINCETON, NJ -- How is the U.S. economy doing? To a significant degree, the answer to that question depends on whom you ask. Many official economic statistics look relatively promising. The government reported over 200,000 new jobs were created in July, retail sales are up, manufacturing is up, leading economic indicators are up, and the economy is robust enough in general to prompt the Federal Reserve Board to continue to raise short-term interest rates.
Last week President Bush expressed his confidence in the economy. He is quoted on the Web site www.whitehouse.gov as saying, "The economy of the United States is strong, and the foundation for sustained growth is in place."
But it's not at all clear that the average American agrees that the economy is strong, and it's equally unclear if Americans share the bullish outlook on the economy that the official statistics might suggest.
Gallup's August economic update shows that Americans, on average, continue to believe that economic conditions in the United States are getting worse, not better. Only a little more than a third are willing to rate the economy as "excellent" or "good." A majority says it is a bad time to find a quality job. And about a third of Americans tell us that some aspect of the economy is the most important problem facing the country today.
In none of these instances are there signs of a sustained recovery in consumer confidence. In most cases, the public's views on the economy remain more depressed than they were at the beginning of this year or on average last year.
The following chart presents the trends on two key measures of the economy since the beginning of the Bush administration.
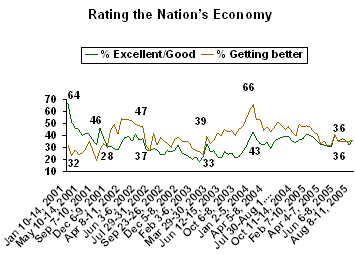
The relative optimism of the American public -- measured as the percentage who say the U.S. economy has been getting better (as opposed to getting worse) -- has been the more volatile of these two measures, swinging from a Bush administration low point of 19% in Sep. 7-10, 2001 (just before the 9/11 terrorist attacks) to a high point of 66% in Jan. 2-5, 2004.
The average "getting better" percentage across the Bush administration has been 39.4%. The current 36% "getting better" figure is thus slightly below average for the time period since January 2001.
We can describe the pattern of economic optimism across the four and a half years of the Bush administration as follows:
1. Two periods of relative optimism -- the first coming late in 2001 and into 2002, and the second coming in late 2003 and extending into early 2004.
2. A decidedly downbeat period from the summer of 2002 to the summer of 2003.
3. The current period of mid-range doldrums.
The public's views of the current economy -- measured as the percentage of Americans rating the economy as excellent or good -- is less volatile, and can be described as follows:
1. Low relative ratings in 2002 and 2003, with a Bush administration low point of 18% rating the economy as excellent or good in Feb. 17-19, 2003.
2. A Bush administration high point of 51% in February 2001, just as Bush took office (and 67% in an early January 2001 poll before he was inaugurated).
3. Relative high points in these ratings came in spring 2002 and late 2003/early 2004.
Currently, 36% of Americans rate the economy as excellent or good, slightly above the average of 33% for the four and a half years of the Bush administration so far.
Here's a more detailed look at the data for the past 12 months.
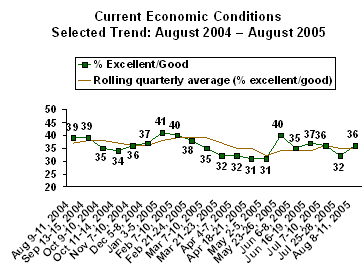
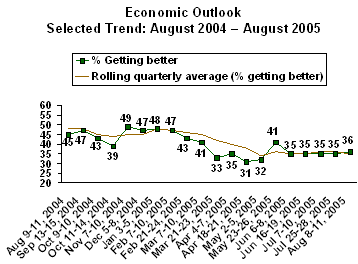
Both economic optimism ("getting better") and the rating of current economic conditions (percentage excellent or good) reached their low points for the year in mid-March through early May, and have recovered slightly since that point. The current readings, however, are still lower than they were as the year began. Additionally, as can be seen, economic confidence has been very steady across the summer months, showing no signs of significant upward movement.
Jobs?
Forty-two percent of Americans who are working or looking for work say that now is a good time to find a quality job, basically unchanged for the year. This perception of the job market is, however, somewhat higher than it was in 2003, when at one point (Mar. 3-5, 2003) only 16% of workers or those looking for work said that it was a good time to look for a quality job.
The Economy as Most Important Problem
Thirty-two percent of Americans mention some aspect of the economy as the most important problem facing the country today, which is little changed from previous months' polls, conducted this year. The specific economic problems mentioned by Americans are:
|
Most Important Problem Facing Country, |
|
|
% |
|
|
The economy in general |
13 |
|
Unemployment/jobs |
8 |
|
Fuel/oil prices |
8 |
|
High cost of living/inflation |
3 |
|
Federal budget deficit |
2 |
|
Lack of money; Taxes; Wage issues |
1% each |
Survey Methods
These results are based in part on telephone interviews with a randomly selected national sample of 1,001 adults, aged 18 and older, conducted Aug. 8-11, 2005. For results based on this sample, one can say with 95% confidence that the maximum error attributable to sampling and other random effects is ±3 percentage points. In addition to sampling error, question wording and practical difficulties in conducting surveys can introduce error or bias into the findings of public opinion polls.
4. What do you think is the most important problem facing this country today? [OPEN-ENDED]
|
Aug |
Jul |
Jun |
May |
Apr |
Mar |
Feb |
||
|
% |
% |
% |
% |
% |
% |
% |
||
|
ECONOMIC PROBLEMS (NET) |
32 |
27 |
30 |
33 |
34 |
28 |
29 |
|
|
1 |
Economy in general |
13 |
10 |
12 |
12 |
12 |
10 |
12 |
|
2 |
Unemployment/jobs |
8 |
8 |
9 |
8 |
8 |
8 |
7 |
|
3 |
Fuel/oil prices |
8 |
6 |
4 |
8 |
9 |
2 |
1 |
|
4 |
High cost of living/inflation |
3 |
2 |
1 |
1 |
3 |
1 |
2 |
|
5 |
Federal budget deficit/federal debt |
2 |
1 |
3 |
3 |
3 |
3 |
5 |
|
6 |
Lack of money |
1 |
1 |
1 |
1 |
1 |
1 |
1 |
|
7 |
Taxes |
1 |
1 |
1 |
1 |
1 |
2 |
2 |
|
8 |
Wage issues |
1 |
1 |
1 |
1 |
1 |
2 |
* |
|
9 |
Foreign trade/trade deficit |
* |
1 |
* |
* |
* |
* |
* |
|
10 |
Gap between rich and poor |
* |
* |
1 |
* |
1 |
* |
1 |
|
11 |
Corporate corruption |
* |
* |
* |
* |
* |
* |
* |
|
Recession |
-- |
-- |
-- |
-- |
-- |
* |
-- |
|
|
|
|
|
|
|
|
|
||
|
NON-ECONOMIC PROBLEMS (NET) |
78 |
82 |
74 |
74 |
73 |
80 |
83 |
|
|
1 |
Situation in Iraq/war |
27 |
25 |
22 |
21 |
18 |
25 |
24 |
|
2 |
Terrorism |
10 |
17 |
8 |
5 |
8 |
9 |
9 |
|
3 |
Poor healthcare/hospitals; high cost of health care |
8 |
7 |
9 |
7 |
7 |
9 |
10 |
|
4 |
Dissatisfaction with government/ Congress/politicians/ candidates; Poor leadership; corruption |
7 |
6 |
8 |
5 |
5 |
6 |
7 |
|
5 |
Ethics/moral/religious/family decline; dishonesty; lack of integrity |
6 |
6 |
6 |
4 |
6 |
4 |
6 |
|
6 |
Immigration/illegal aliens |
5 |
4 |
5 |
5 |
4 |
3 |
3 |
|
7 |
Poverty/hunger/homelessness |
5 |
5 |
4 |
4 |
2 |
3 |
4 |
|
8 |
Education/poor education/access to education |
5 |
3 |
5 |
5 |
6 |
6 |
5 |
|
9 |
Social Security |
3 |
4 |
6 |
9 |
8 |
12 |
12 |
|
10 |
National security |
3 |
4 |
2 |
3 |
3 |
5 |
4 |
|
11 |
Lack of energy sources; the energy crisis |
2 |
1 |
* |
1 |
1 |
* |
* |
|
12 |
Crime/violence |
2 |
1 |
2 |
4 |
1 |
2 |
1 |
|
13 |
Foreign aid/focus overseas |
2 |
2 |
5 |
2 |
2 |
3 |
4 |
|
14 |
Judicial system/courts/laws |
2 |
3 |
2 |
2 |
2 |
1 |
1 |
|
15 |
International issues/ problems |
2 |
2 |
2 |
2 |
2 |
2 |
3 |
|
16 |
Drugs |
2 |
2 |
2 |
1 |
1 |
1 |
1 |
|
17 |
Children's behavior/way they are raised |
2 |
* |
1 |
1 |
1 |
2 |
* |
|
18 |
Environment/pollution |
1 |
1 |
1 |
1 |
1 |
1 |
1 |
|
19 |
Medicare |
1 |
1 |
1 |
1 |
2 |
1 |
1 |
|
20 |
Unifying the country |
1 |
1 |
* |
1 |
1 |
1 |
1 |
|
21 |
Abortion |
1 |
1 |
1 |
* |
1 |
* |
1 |
|
22 |
Lack of respect for each other |
1 |
* |
1 |
1 |
1 |
2 |
1 |
|
23 |
Welfare |
1 |
1 |
1 |
1 |
1 |
1 |
1 |
|
24 |
Care for the elderly |
* |
* |
* |
1 |
1 |
1 |
1 |
|
25 |
The media |
* |
* |
* |
* |
* |
-- |
1 |
|
26 |
Homosexuality/gay issues |
* |
* |
* |
* |
1 |
* |
1 |
|
27 |
Race relations/racism |
* |
* |
* |
1 |
1 |
* |
* |
|
28 |
Child abuse |
* |
* |
* |
-- |
* |
-- |
-- |
|
29 |
Election year/presidential choices/election reform |
* |
* |
-- |
* |
-- |
* |
* |
|
30 |
Abuse of power |
* |
* |
-- |
* |
* |
* |
* |
|
Guns/gun control |
-- |
* |
-- |
* |
-- |
* |
* |
|
|
Overpopulation |
-- |
* |
* |
* |
* |
* |
-- |
|
|
Cancer/diseases |
-- |
-- |
-- |
-- |
* |
* |
-- |
|
|
|
|
|
|
|
|
|
||
|
Other non-economic |
5 |
2 |
5 |
4 |
3 |
1 |
2 |
|
|
|
|
|
|
|
|
|
||
|
No opinion |
3 |
3 |
3 |
3 |
2 |
3 |
2 |
|
|
Total |
144% |
133% |
135% |
130% |
131% |
133% |
138% |
|
|
* = Less than 0.5% |
||||||||
5. How would you rate economic conditions in this country today -- as excellent, good, only fair, or poor?
|
Excel |
|
Only |
|
No |
|
|
2005 |
% |
% |
% |
% |
% |
|
2005 Aug 8-11 |
4 |
32 |
46 |
18 |
* |
|
|
|
|
|
|
|
|
2005 Jul 25-28 |
4 |
28 |
44 |
23 |
1 |
|
2005 Jul 7-10 |
3 |
33 |
45 |
18 |
1 |
|
2005 Jun 16-19 |
4 |
33 |
40 |
23 |
* |
|
2005 Jun 6-8 |
4 |
31 |
45 |
20 |
* |
|
2005 May 23-26 |
3 |
37 |
41 |
19 |
* |
|
2005 May 2-5 |
1 |
30 |
44 |
25 |
* |
|
2005 Apr 18-21 |
2 |
29 |
44 |
24 |
1 |
|
2005 Apr 4-7 |
3 |
29 |
49 |
18 |
1 |
|
2005 Mar 21-23 |
2 |
30 |
43 |
24 |
1 |
|
2005 Mar 7-10 |
3 |
32 |
48 |
16 |
1 |
|
2005 Feb 21-24 |
5 |
33 |
42 |
20 |
* |
|
2005 Feb 7-10 |
3 |
37 |
44 |
16 |
* |
|
2005 Jan 3-5 |
3 |
38 |
42 |
17 |
* |
|
2004 |
|
|
|
|
|
|
2004 Dec 5-8 |
2 |
35 |
43 |
19 |
1 |
|
2004 Nov 7-10 |
3 |
33 |
44 |
20 |
* |
|
2004 Oct 11-14 |
2 |
32 |
44 |
22 |
* |
|
2004 Oct 9-10 |
4 |
31 |
40 |
24 |
1 |
|
2004 Sep 13-15 |
3 |
36 |
39 |
22 |
* |
|
2004 Aug 9-11 |
3 |
36 |
40 |
21 |
* |
|
2004 Jul 30-Aug 1 |
6 |
32 |
39 |
23 |
* |
|
2004 Jul 8-11 |
5 |
32 |
41 |
21 |
1 |
|
2004 Jun 3-6 |
3 |
32 |
44 |
21 |
* |
|
2004 May 2-4 |
2 |
27 |
43 |
27 |
1 |
|
2004 Apr 5-8 |
3 |
31 |
44 |
22 |
* |
|
2004 Mar 8-11 |
2 |
30 |
44 |
24 |
* |
|
2004 Feb 9-12 |
2 |
31 |
46 |
21 |
-- |
|
2004 Jan 12-15 |
3 |
34 |
42 |
21 |
-- |
|
2004 Jan 2-5 |
3 |
40 |
41 |
16 |
* |
|
2003 |
|
|
|
|
|
|
2003 Dec 11-14 |
3 |
34 |
44 |
19 |
* |
|
2003 Nov 3-5 |
2 |
28 |
49 |
21 |
* |
|
2003 Oct 24-26 |
2 |
24 |
44 |
30 |
* |
|
2003 Oct 6-8 |
2 |
20 |
50 |
27 |
1 |
|
2003 Sep 8-10 |
1 |
20 |
49 |
30 |
* |
|
2003 Aug 4-6 |
1 |
24 |
52 |
23 |
* |
|
2003 Jul 7-9 |
1 |
23 |
50 |
26 |
* |
|
2003 Jun 12-15 |
1 |
25 |
49 |
25 |
* |
|
2003 May 19-21 |
1 |
20 |
47 |
31 |
1 |
|
2003 May 5-7 |
1 |
21 |
50 |
28 |
* |
|
2003 Apr 7-9 |
2 |
25 |
51 |
22 |
* |
|
2003 Mar 29-30 |
1 |
25 |
51 |
23 |
* |
|
2003 Mar 24-25 |
3 |
30 |
47 |
20 |
-- |
|
2003 Mar 3-5 |
1 |
21 |
46 |
32 |
* |
|
2003 Feb 17-19 |
1 |
17 |
48 |
34 |
* |
|
2003 Feb 3-6 |
2 |
20 |
53 |
25 |
* |
|
2003 Jan 20-22 |
1 |
19 |
49 |
31 |
* |
|
2003 Jan 13-16 |
2 |
20 |
50 |
28 |
* |
|
2002 |
|
|
|
|
|
|
2002 Dec 19-22 |
1 |
23 |
48 |
28 |
* |
|
2002 Dec 5-8 |
2 |
23 |
51 |
24 |
* |
|
2002 Nov 22-24 |
2 |
30 |
45 |
23 |
* |
|
2002 Oct 31-Nov 3 |
2 |
26 |
45 |
26 |
1 |
|
2002 Oct 3-6 |
2 |
24 |
46 |
27 |
1 |
|
2002 Sep 23-26 |
2 |
25 |
47 |
25 |
1 |
|
2002 Sep 5-8 |
2 |
22 |
53 |
23 |
* |
|
2002 Aug 19-21 |
1 |
23 |
47 |
28 |
1 |
|
2002 Aug 5-8 |
1 |
27 |
52 |
19 |
1 |
|
2002 Jul 29-31 |
2 |
27 |
48 |
22 |
1 |
|
2002 Jul 22-24 |
2 |
25 |
48 |
24 |
1 |
|
2002 Jul 9-11 |
2 |
26 |
51 |
20 |
1 |
|
2002 Jun 17-19 |
2 |
35 |
43 |
19 |
1 |
|
2002 Jun 3-6 |
3 |
33 |
49 |
14 |
1 |
|
2002 May 20-22 |
3 |
38 |
46 |
12 |
1 |
|
2002 May 6-9 |
2 |
33 |
51 |
14 |
* |
|
2002 Apr 22-24 |
2 |
37 |
46 |
14 |
1 |
|
2002 Apr 8-11 |
2 |
36 |
51 |
11 |
* |
|
2002 Mar 4-7 |
3 |
31 |
51 |
14 |
1 |
|
2002 Feb 4-6 |
2 |
26 |
55 |
16 |
1 |
|
2002 Jan 7-9 |
2 |
27 |
54 |
16 |
1 |
|
2001 |
|
|
|
|
|
|
2001 Dec 6-9 |
2 |
29 |
53 |
16 |
* |
|
2001 Nov 8-11 |
2 |
29 |
50 |
19 |
* |
|
2001 Oct 11-14 |
2 |
36 |
48 |
13 |
1 |
|
2001 Sep 14-15 |
3 |
43 |
44 |
9 |
1 |
|
2001 Sep 7-10 |
2 |
30 |
49 |
19 |
* |
|
2001 Aug 16-19 |
2 |
34 |
49 |
14 |
1 |
|
2001 Jul 19-22 |
3 |
38 |
47 |
11 |
1 |
|
2001 Jun 11-17 |
3 |
39 |
45 |
12 |
1 |
|
2001 May 10-14 |
3 |
37 |
45 |
15 |
* |
|
2001 Apr 6-8 |
4 |
41 |
41 |
14 |
* |
|
2001 Mar 5-7 |
3 |
43 |
43 |
10 |
1 |
|
2001 Feb 1-4 |
7 |
44 |
36 |
13 |
* |
|
2001 Jan 10-14 |
11 |
56 |
27 |
6 |
* |
|
2000 |
|
|
|
|
|
|
2000 Dec 2-4 |
12 |
51 |
28 |
8 |
1 |
|
2000 Nov 13-15 |
19 |
53 |
21 |
7 |
* |
|
2000 Oct 6-9 |
14 |
57 |
24 |
4 |
1 |
|
2000 Aug 18-19 |
25 |
49 |
21 |
4 |
1 |
|
2000 Jul 25-26 |
26 |
48 |
21 |
4 |
1 |
|
2000 May 18-21 |
17 |
49 |
24 |
9 |
1 |
|
2000 Apr 3-9 |
14 |
46 |
30 |
9 |
1 |
|
2000 Jan 7-10 |
19 |
52 |
23 |
5 |
1 |
|
1999 |
|
|
|
|
|
|
1999 Oct 21-24 |
16 |
49 |
27 |
8 |
* |
|
1999 Sep 10-14 |
20 |
47 |
24 |
8 |
1 |
|
1999 Aug 24-26 |
14 |
50 |
28 |
7 |
1 |
|
1999 Jun 4-5 |
18 |
56 |
21 |
5 |
* |
|
1999 Jan 15-17 |
14 |
55 |
27 |
4 |
* |
|
1998 |
|
|
|
|
|
|
1998 Dec 4-6 |
13 |
52 |
27 |
8 |
* |
|
1998 Oct 29-Nov 1 |
13 |
53 |
27 |
6 |
1 |
|
1998 Sep 1 |
11 |
54 |
25 |
9 |
1 |
|
1998 Mar 20-22 |
20 |
46 |
27 |
7 |
* |
|
1997 |
Excel |
Good |
Only |
Poor |
No |
|
1997 Dec 18-21 |
7 |
41 |
38 |
12 |
2 |
|
1997 Nov 6-9 |
10 |
48 |
33 |
9 |
* |
|
1997 Aug 22-25^ |
8 |
41 |
38 |
13 |
* |
|
1997 May 6-7 |
7 |
39 |
38 |
15 |
1 |
|
1997 Jan 31-Feb 2 |
4 |
38 |
43 |
15 |
* |
|
1996 |
|
|
|
|
|
|
1996 Oct 26-29 |
5 |
42 |
39 |
13 |
1 |
|
1996 Aug 30-Sep 1 † |
3 |
34 |
46 |
16 |
1 |
|
1996 Jul 18-21 |
5 |
38 |
43 |
14 |
* |
|
1996 May 9-12 |
3 |
27 |
50 |
19 |
1 |
|
1996 Apr 9-10 |
1 |
26 |
52 |
20 |
1 |
|
1996 Mar 15-17 |
2 |
31 |
48 |
18 |
1 |
|
1996 Jan 5-7 |
1 |
28 |
47 |
23 |
1 |
|
1995 |
|
|
|
|
|
|
1995 Nov 6-8 |
2 |
28 |
47 |
22 |
1 |
|
1995 May 11-14 |
2 |
27 |
50 |
20 |
1 |
|
1994 |
|
|
|
|
|
|
1994 Dec 16-18 |
2 |
25 |
52 |
21 |
* |
|
1994 Nov 2-6 |
2 |
28 |
49 |
20 |
1 |
|
1994 Oct 22-25 |
1 |
25 |
52 |
21 |
1 |
|
1994 Jul 15-17 |
1 |
26 |
52 |
21 |
* |
|
1994 Apr 22-24 |
1 |
23 |
49 |
26 |
1 |
|
1994 Jan 15-17 |
* |
22 |
54 |
24 |
* |
|
1993 |
|
|
|
|
|
|
1993 Dec 4-6 |
1 |
20 |
57 |
21 |
1 |
|
1993 Nov 2-4 |
1 |
16 |
50 |
33 |
* |
|
1993 Aug 8-10 |
* |
10 |
49 |
40 |
1 |
|
1993 Jun 29-30 |
1 |
14 |
52 |
32 |
1 |
|
1993 Feb 12-14 |
* |
14 |
46 |
39 |
1 |
|
1992 |
|
|
|
|
|
|
1992 Dec 18-20 |
2 |
16 |
34 |
47 |
1 |
|
1992 Dec 4-6 |
1 |
14 |
41 |
43 |
1 |
|
1992 Oct 23-25 |
* |
11 |
45 |
43 |
1 |
|
1992 Sep 11-15 |
1 |
10 |
37 |
51 |
1 |
|
1992 Aug 31-Sep 2 † |
1 |
9 |
37 |
53 |
* |
|
1992 Jun 12-14 † |
1 |
11 |
47 |
41 |
* |
|
1992 Apr 9-12 † |
1 |
11 |
40 |
48 |
* |
|
1992 Jan 3-6 |
* |
12 |
46 |
41 |
1 |
|
* = Less than 0.5% |
|||||
|
^ Asked of half sample |
|||||
|
† Asked of Registered Voters |
|||||
6. Right now, do you think that economic conditions in the country as a whole are getting better or getting worse?
|
Getting |
Getting |
SAME |
No opinion |
|
|
2005 |
% |
% |
% |
% |
|
2005 Aug 8-11 |
36 |
52 |
9 |
3 |
|
|
|
|
|
|
|
2005 Jul 25-28 |
35 |
53 |
9 |
3 |
|
2005 Jul 7-10 |
35 |
54 |
8 |
3 |
|
2005 Jun 16-19 |
35 |
57 |
6 |
2 |
|
2005 Jun 6-8 |
35 |
55 |
8 |
2 |
|
2005 May 23-26 |
41 |
52 |
5 |
2 |
|
2005 May 2-5 |
32 |
61 |
6 |
1 |
|
2005 Apr 18-21 |
31 |
61 |
5 |
3 |
|
2005 Apr 4-7 |
35 |
56 |
6 |
3 |
|
2005 Mar 21-23 |
33 |
59 |
6 |
2 |
|
2005 Mar 7-10 |
41 |
50 |
6 |
3 |
|
2005 Feb 21-24 |
43 |
48 |
7 |
2 |
|
2005 Feb 7-10 |
47 |
44 |
7 |
2 |
|
2005 Jan 3-5 |
48 |
42 |
7 |
3 |
|
2004 |
|
|
|
|
|
2004 Dec 5-8 |
47 |
42 |
8 |
3 |
|
2004 Nov 7-10 |
49 |
43 |
6 |
2 |
|
2004 Oct 11-14 |
39 |
50 |
8 |
3 |
|
2004 Oct 9-10 |
43 |
48 |
7 |
2 |
|
2004 Sep 13-15 |
47 |
45 |
6 |
2 |
|
2004 Aug 9-11 |
45 |
46 |
7 |
2 |
|
2004 Jul 30-Aug 1 |
48 |
43 |
7 |
2 |
|
2004 Jul 8-11 |
51 |
38 |
7 |
4 |
|
2004 Jun 3-6 |
47 |
45 |
6 |
2 |
|
2004 May 2-4 |
43 |
51 |
4 |
2 |
|
2004 Apr 5-8 |
47 |
45 |
6 |
2 |
|
2004 Mar 8-11 |
44 |
47 |
7 |
2 |
|
2004 Feb 9-12 |
53 |
40 |
6 |
1 |
|
2004 Jan 12-15 |
53 |
39 |
6 |
2 |
|
2004 Jan 2-5 |
66 |
27 |
4 |
3 |
|
2003 |
|
|
|
|
|
2003 Dec 11-14 |
60 |
32 |
7 |
1 |
|
2003 Nov 3-5 |
53 |
37 |
8 |
2 |
|
2003 Oct 24-26 |
47 |
43 |
8 |
2 |
|
2003 Oct 6-8 |
45 |
46 |
7 |
2 |
|
2003 Sep 8-10 |
40 |
50 |
8 |
2 |
|
2003 Aug 4-6 |
44 |
45 |
9 |
2 |
|
2003 Jul 7-9 |
43 |
47 |
8 |
2 |
|
2003 Jun 12-15 |
45 |
43 |
10 |
2 |
|
2003 May 19-21 |
40 |
48 |
10 |
2 |
|
2003 May 5-7 |
42 |
51 |
5 |
2 |
|
2003 Apr 7-9 |
36 |
51 |
11 |
2 |
|
2003 Mar 29-30 |
33 |
56 |
9 |
2 |
|
2003 Mar 24-25 |
39 |
47 |
11 |
3 |
|
2003 Mar 3-5 |
23 |
67 |
7 |
3 |
|
2003 Feb 17-19 |
26 |
63 |
9 |
2 |
|
2003 Feb 3-6 |
27 |
60 |
11 |
2 |
|
2003 Jan 20-22 |
29 |
57 |
12 |
2 |
|
2003 Jan 13-16 |
34 |
54 |
10 |
2 |
|
2002 |
|
|
|
|
|
2002 Dec 19-22 |
35 |
50 |
12 |
3 |
|
2002 Dec 5-8 |
35 |
54 |
8 |
3 |
|
2002 Nov 22-24 |
38 |
53 |
8 |
1 |
|
2002 Oct 31-Nov 3 |
37 |
51 |
8 |
4 |
|
2002 Oct 3-6 |
30 |
59 |
8 |
3 |
|
2002 Sep 23-26 |
33 |
52 |
10 |
5 |
|
2002 Sep 5-8 |
35 |
54 |
9 |
2 |
|
2002 Aug 19-21 |
38 |
48 |
10 |
4 |
|
2002 Aug 5-8 |
32 |
55 |
9 |
4 |
|
2002 Jul 29-31 |
42 |
47 |
8 |
3 |
|
2002 Jul 22-24 |
27 |
59 |
10 |
4 |
|
2002 Jul 9-11 |
31 |
57 |
10 |
2 |
|
2002 Jun 17-19 |
47 |
40 |
10 |
3 |
|
2002 Jun 3-6 |
48 |
38 |
11 |
3 |
|
2002 May 20-22 |
49 |
34 |
14 |
3 |
|
2002 May 6-9 |
52 |
39 |
7 |
2 |
|
2002 Apr 22-24 |
53 |
35 |
10 |
2 |
|
2002 Apr 8-11 |
53 |
37 |
7 |
3 |
|
2002 Mar 4-7 |
54 |
37 |
7 |
2 |
|
2002 Feb 4-6 |
41 |
47 |
10 |
2 |
|
2002 Jan 7-9 |
49 |
41 |
8 |
2 |
|
2001 |
|
|
|
|
|
2001 Dec 6-9 |
44 |
48 |
6 |
2 |
|
2001 Nov 8-11 |
30 |
59 |
7 |
4 |
|
2001 Oct 11-14 |
33 |
55 |
10 |
2 |
|
2001 Sep 14-15 |
28 |
60 |
8 |
4 |
|
2001 Sep 7-10 |
19 |
70 |
9 |
2 |
|
2001 Aug 16-19 |
27 |
59 |
11 |
3 |
|
2001 Jul 19-22 |
35 |
53 |
9 |
3 |
|
2001 Jun 11-17 |
29 |
60 |
8 |
3 |
|
2001 May 10-14 |
25 |
63 |
9 |
3 |
|
2001 Apr 6-8 |
24 |
63 |
9 |
4 |
|
2001 Mar 5-7 |
28 |
61 |
7 |
4 |
|
2001 Feb 1-4 |
23 |
66 |
8 |
3 |
|
2001 Jan 10-14 |
32 |
56 |
8 |
4 |
|
2000 |
|
|
|
|
|
2000 Dec 2-4 |
39 |
48 |
8 |
5 |
|
2000 Nov 13-15 |
50 |
38 |
9 |
3 |
|
2000 Oct 6-9 |
54 |
34 |
10 |
2 |
|
2000 Aug 18-19 |
60 |
26 |
10 |
4 |
|
2000 Jul 25-26 |
58 |
29 |
9 |
4 |
|
2000 May 18-21 |
52 |
37 |
9 |
2 |
|
2000 Jan 7-10 |
69 |
23 |
6 |
2 |
|
1999 |
Getting |
Getting |
SAME |
No opinion |
|
1999 Oct 21-24 |
52 |
34 |
11 |
3 |
|
1999 Sep 10-14 |
59 |
29 |
9 |
3 |
|
1999 Aug 24-26 |
54 |
31 |
12 |
3 |
|
1999 Jun 4-5 |
60 |
27 |
9 |
4 |
|
1999 Jan 15-17 |
63 |
28 |
6 |
3 |
|
1998 |
|
|
|
|
|
1998 Dec 4-6 |
52 |
38 |
8 |
2 |
|
1998 Oct 29-Nov 1 |
51 |
38 |
8 |
3 |
|
1998 Sep 1 |
45 |
41 |
11 |
3 |
|
1997 |
|
|
|
|
|
1997 Dec 18-21 |
49 |
39 |
8 |
4 |
|
1997 Nov 6-9 |
51 |
37 |
9 |
3 |
|
1997 May 6-7 |
50 |
40 |
7 |
3 |
|
1997 Jan 31-Feb 2 |
46 |
39 |
12 |
3 |
|
1996 |
|
|
|
|
|
1996 Oct 26-29 |
50 |
38 |
7 |
5 |
|
1996 Aug 30-Sep 1 |
52 |
37 |
8 |
3 |
|
1996 Jul 18-21 |
43 |
46 |
9 |
2 |
|
1996 May 9-12 |
39 |
49 |
9 |
3 |
|
1992 |
|
|
|
|
|
1992 Aug 31-Sep 2 |
29 |
59 |
10 |
2 |
|
1992 Aug 10-12 |
24 |
65 |
10 |
1 |
|
1992 Jun 12-14 |
28 |
61 |
9 |
2 |
|
1992 Apr 9-12 |
40 |
45 |
13 |
2 |
|
1992 Mar 20-22 |
37 |
51 |
11 |
1 |
|
1992 Jan 31-Feb 1 |
22 |
70 |
7 |
1 |
|
1992 Jan 3-6 |
22 |
71 |
6 |
1 |
|
1991 |
|
|
|
|
|
1991 Dec 5-8 |
19 |
69 |
9 |
3 |
|
1991 Sep 5-8 |
27 |
60 |
10 |
3 |
|
1991 Jul 11-14 |
34 |
51 |
9 |
6 |
|
(vol.) = Volunteered response |
||||
ECONOMIC OUTLOOK GROUPS (COMBINED RESPONSES: Q.5-6)
|
|
|
|
Undesignated |
|
|
2005 |
% |
% |
% |
% |
|
2005 Aug 8-11 |
25 |
22 |
50 |
3 |
|
|
|
|
|
|
|
2005 Jul 25-28 |
25 |
19 |
53 |
3 |
|
2005 Jul 7-10 |
25 |
23 |
49 |
3 |
|
2005 Jun 16-19 |
27 |
18 |
52 |
3 |
|
2005 Jun 6-8 |
25 |
22 |
51 |
2 |
|
2005 May 23-26 |
31 |
21 |
46 |
2 |
|
2005 May 2-5 |
21 |
22 |
55 |
2 |
|
2005 Apr 18-21 |
22 |
20 |
55 |
3 |
|
2005 Apr 4-7 |
23 |
22 |
52 |
3 |
|
2005 Mar 21-23 |
25 |
18 |
54 |
3 |
|
2005 Mar 7-10 |
27 |
24 |
46 |
3 |
|
2005 Feb 21-24 |
31 |
21 |
45 |
3 |
|
2005 Feb 7-10 |
34 |
20 |
44 |
2 |
|
2005 Jan 3-5 |
34 |
23 |
40 |
3 |
|
2004 |
|
|
|
|
|
2004 Dec 5-8 |
32 |
22 |
42 |
4 |
|
2004 Nov 7-10 |
30 |
25 |
43 |
2 |
|
2004 Oct 11-14 |
27 |
21 |
49 |
3 |
|
2004 Oct 9-10 |
30 |
19 |
48 |
3 |
|
2004 Sep 13-15 |
32 |
23 |
43 |
2 |
|
2004 Aug 9-11 |
32 |
22 |
44 |
2 |
|
2004 Jul 30-Aug 1 |
33 |
21 |
43 |
3 |
|
2004 Jul 8-11 |
31 |
26 |
39 |
4 |
|
2004 Jun 3-6 |
27 |
30 |
41 |
2 |
|
2004 May 2-4 |
25 |
23 |
50 |
2 |
|
2004 Apr 5-8 |
28 |
26 |
44 |
2 |
|
2004 Mar 8-11 |
26 |
26 |
46 |
2 |
|
2004 Feb 9-12 |
28 |
31 |
40 |
1 |
|
2004 Jan 12-15 |
30 |
31 |
38 |
1 |
|
2004 Jan 2-5 |
38 |
33 |
26 |
3 |
|
2003 |
|
|
|
|
|
2003 Dec 11-14 |
33 |
33 |
33 |
1 |
|
2003 Nov 3-5 |
25 |
34 |
39 |
2 |
|
2003 Oct 24-26 |
22 |
30 |
46 |
2 |
|
2003 Oct 6-8 |
18 |
32 |
48 |
2 |
|
2003 Sep 8-10 |
17 |
29 |
52 |
2 |
|
2003 Aug 4-6 |
19 |
32 |
47 |
2 |
|
2003 Jul 7-9 |
19 |
31 |
48 |
2 |
|
2003 Jun 12-15 |
21 |
31 |
46 |
2 |
|
2003 May 19-21 |
15 |
32 |
50 |
3 |
|
2003 May 5-7 |
16 |
34 |
48 |
2 |
|
2003 Apr 7-9 |
20 |
27 |
51 |
2 |
|
2003 Mar 29-30 |
18 |
26 |
54 |
2 |
|
2003 Mar 24-25 |
24 |
28 |
45 |
3 |
|
2003 Mar 3-5 |
12 |
20 |
64 |
4 |
|
2003 Feb 17-19 |
11 |
24 |
63 |
2 |
|
2003 Feb 3-6 |
12 |
27 |
59 |
2 |
|
2003 Jan 20-22 |
13 |
26 |
59 |
2 |
|
2003 Jan 13-16 |
14 |
29 |
54 |
3 |
|
2002 |
|
|
|
|
|
2002 Dec 19-22 |
17 |
26 |
54 |
3 |
|
2002 Dec 5-8 |
17 |
27 |
53 |
3 |
|
2002 Nov 22-24 |
22 |
29 |
48 |
1 |
|
2002 Oct 31-Nov 3 |
20 |
27 |
49 |
4 |
|
2002 Oct 3-6 |
16 |
25 |
55 |
4 |
|
2002 Sep 23-26 |
20 |
21 |
53 |
6 |
|
2002 Sep 5-8 |
16 |
29 |
53 |
2 |
|
2002 Aug 19-21 |
19 |
26 |
51 |
4 |
|
2002 Aug 5-8 |
16 |
30 |
50 |
4 |
|
2002 Jul 29-31 |
22 |
30 |
45 |
3 |
|
2002 Jul 22-24 |
16 |
24 |
55 |
5 |
|
2002 Jul 9-11 |
16 |
29 |
52 |
3 |
|
2002 Jun 17-19 |
30 |
27 |
40 |
3 |
|
2002 Jun 3-6 |
29 |
29 |
39 |
3 |
|
2002 May 20-22 |
33 |
28 |
36 |
3 |
|
2002 May 6-9 |
28 |
32 |
37 |
3 |
|
2002 Apr 22-24 |
32 |
31 |
34 |
3 |
|
2002 Apr 8-11 |
30 |
32 |
35 |
3 |
|
2002 Mar 4-7 |
26 |
36 |
35 |
3 |
|
2002 Feb 4-6 |
19 |
31 |
47 |
3 |
|
2002 Jan 7-9 |
21 |
37 |
40 |
2 |
|
2001 |
|
|
|
|
|
2001 Dec 6-9 |
20 |
35 |
42 |
3 |
|
2001 Nov 8-11 |
17 |
29 |
50 |
4 |
|
2001 Oct 11-14 |
21 |
33 |
43 |
3 |
|
2001 Sep 14-15 |
23 |
29 |
43 |
5 |
|
2001 Sep 7-10 |
15 |
24 |
59 |
2 |
|
2001 Aug 16-19 |
20 |
27 |
50 |
3 |
|
2001 Jul 19-22 |
25 |
29 |
42 |
4 |
|
2001 Jun 11-17 |
22 |
28 |
45 |
5 |
|
2001 May 10-14 |
20 |
28 |
49 |
3 |
|
2001 Apr 6-8 |
21 |
30 |
44 |
5 |
|
2001 Mar 5-7 |
22 |
33 |
41 |
4 |
|
2001 Feb 1-4 |
22 |
33 |
42 |
3 |
|
2001 Jan 10-14 |
30 |
40 |
26 |
4 |
|
2000 |
|
|
|
|
|
2000 Dec 2-4 |
36 |
35 |
25 |
4 |
|
2000 Nov 13-15 |
47 |
32 |
18 |
3 |
|
2000 Oct 6-9 |
51 |
28 |
18 |
3 |
|
2000 Jul 25-26 |
57 |
23 |
16 |
4 |
|
2000 May 18-21 |
48 |
28 |
21 |
3 |
|
2000 Jan 7-10 |
61 |
21 |
15 |
3 |
|
1999 |
Positive |
Mixed |
Negative |
Undesignated |
|
1999 Oct 21-24 |
50 |
24 |
23 |
3 |
|
1999 Sep 10-14 |
55 |
22 |
19 |
4 |
|
1999 Aug 24-26 |
48 |
28 |
21 |
3 |
|
1999 Jun 4-5 |
59 |
20 |
17 |
4 |
|
1999 Jan 15-17 |
54 |
26 |
17 |
3 |
|
1998 |
|
|
|
|
|
1998 Dec 4-6 |
47 |
28 |
23 |
2 |
|
1998 Oct 29-Nov 1 |
47 |
27 |
22 |
4 |
|
1998 Sep 1 |
45 |
27 |
24 |
4 |
|
1998 Mar 20-22 |
59 |
21 |
18 |
2 |
|
1997 |
|
|
|
|
|
1997 Dec 18-21 |
36 |
28 |
31 |
5 |
|
1997 Nov 6-9 |
46 |
23 |
28 |
3 |
|
1997 May 6-7 |
38 |
23 |
36 |
3 |
|
1997 Jan 31-Feb 2 |
33 |
24 |
40 |
3 |
|
1996 |
|
|
|
|
|
1996 Oct 26-29 |
37 |
25 |
33 |
5 |
|
1996 Aug 30-Sep 1 |
31 |
29 |
36 |
4 |
|
1996 July 18-21 |
32 |
25 |
40 |
3 |
|
1996 May 9-12 |
22 |
28 |
47 |
3 |
|
1992 |
|
|
|
|
|
1992 Aug 31-Sep 2 |
7 |
25 |
66 |
2 |
|
1992 Jun 12-14 |
8 |
25 |
65 |
2 |