GALLUP NEWS SERVICE
PRINCETON, NJ -- Gallup's annual Governance survey, conducted Sept. 12-15, suggests that the events surrounding Hurricane Katrina have thus far had little effect on Americans' fundamental levels of confidence in the federal government, just as Katrina had little immediate impact on Gallup's ratings of President George W. Bush. In contrast, the 9/11 terrorist attacks immediately boosted Bush's approval ratings and ultimately strengthened public confidence in the federal government for a sustained period.
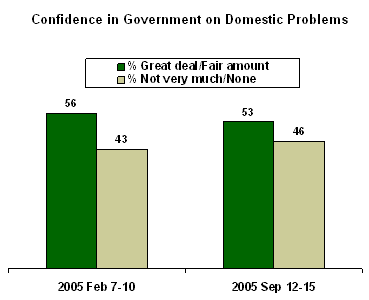
The percentage of Americans who now trust the federal government in Washington to handle domestic problems stands about where it did when last measured seven months ago: 53% have either a great deal or a fair amount of confidence. In February the figure was 56%.
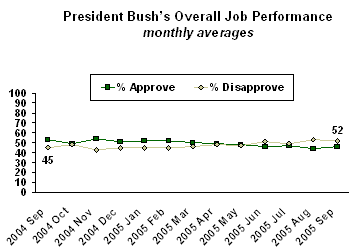
Americans' overall trust and confidence in the executive branch of the federal government has declined slightly compared with the previous reading -- it was 58% in September 2004 vs. 52% today -- but this conforms with a slight dip in Bush's overall job approval rating over the same period.
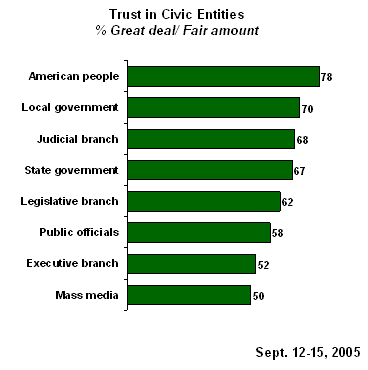
There has also been no significant year-to-year change in public trust in state and local governments. About two-thirds of Americans today say they have trust and confidence in these, nearly identical to last September's readings.
Media and Executive Branch Have Low Ranking
The Governance survey audits Americans' confidence levels in a variety of entities that contribute to public affairs in the United States: the three branches of the federal government, state and local governments, public officials themselves, the media, and the American public. Of these, Americans express the greatest amount of trust in the American public and the least in the mass media and the executive branch of government.
Nearly four in five Americans say they have a great deal or fair amount of trust in the American people "when it comes to making judgments under our democratic system about the issues facing our country."
The next-most-highly rated civic players are local governments, the judicial branch of the federal government, and state governments. About two-thirds of Americans rate each of these highly.
Roughly 6 in 10 give high marks to the legislative branch of the federal government and to the men and women who serve in public office.
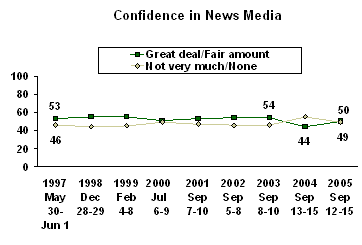
Just half give high marks to the mass media for "reporting the news fully, accurately, and fairly"; 49% say they have not very much or no confidence at all in the mass media. Similarly, just 52% express confidence in the executive branch of government, while 48% express little or no confidence.
Trust in Federal Government's Abilities
Gallup's frequent measurement of two questions included in the Governance survey shows that 9/11 corresponded with a sharp increase in Americans' trust in the federal government to handle domestic as well as international problems. Between September 2001 and October 2001, the percentage expressing confidence in the government's handling of these areas increased from 68% to 83% for international problems, and from 60% to 77% for domestic problems. Confidence levels remained elevated in subsequent polls conducted in February and June 2002, but by September 2002 these had returned to pre-9/11 levels.
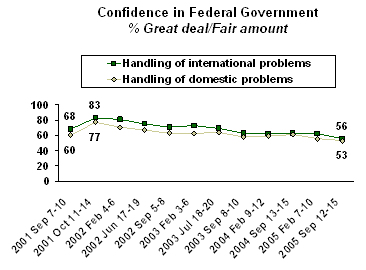
Since 2002, there has been a continued slide in public confidence on these two dimensions -- a slide that corresponds with increasing public concerns about the Iraq war and the U.S. economy, and with decreasing ratings of President Bush more generally.
Decreasing public support for the Iraq war is the most likely explanation for the six-point decline since February of this year in the government's ratings on its handling of international problems. Since that time, the percentage saying they approve of the job Bush is doing on Iraq has fallen from 50% to 40% and the percentage saying that sending troops to Iraq was a mistake has risen from 45% to 53%. (Subsequent Gallup measures of Bush approval on Iraq are even lower than they were at the time of the Governance poll.)
Similarly, since early February, the percentage of Americans expressing positive sentiments about the U.S. economy has declined from 34% to 21%.
Other Recent Trends
Besides reduced public confidence in the federal government's handling of international problems and in the executive branch of government more specifically, the other significant changes recorded this year are a slight increase in public trust in media and a slight decline in trust in public officials.
Americans' trust in the media has partially rebounded after declining from 54% in 2003 to 44% last year. (The cause of last year's drop is not clear, but the most visible news controversy at the time involved CBS News anchor Dan Rather's reliance on faulty documents in his report that was critical of President Bush's service in the National Guard.) Today, 50% say they have at least a fair amount of trust and confidence in the news media.
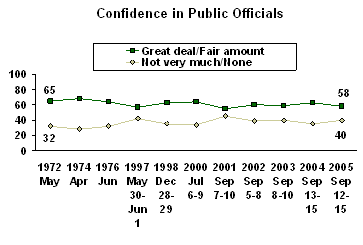
The percentage of Americans saying they have a great deal or fair amount of trust in the men and women serving in public office fell five points over the past year, from 63% in 2004 to 58% today. But last year's level was unusually high, so that the current figure is consistent with where this stood in 2002 and 2003.
At the same time, there has been no significant change in Americans' expressed confidence in the judicial or legislative branches, or in state or local governments, or in the American people.
Ratings Disparities Among the Parties
Republicans and Democrats differ sharply in the levels of confidence expressed toward the executive branch, as well as toward the news media. Republicans are much more positive about the executive branch than are Democrats -- naturally so, given that the head of the executive branch (President Bush) is a Republican. Democrats, who are much more likely than Republicans to be satisfied with the political leanings of the news media, give much higher confidence ratings to the media.
All other partisan differences -- even with respect to the legislative branch of government, currently controlled by the Republican Party -- are relatively minor.
|
% Trust a Great Deal/Fair Amount by Party ID |
|||
|
Republicans |
Independents |
Democrats |
|
|
% |
% |
% |
|
|
Executive branch |
90 |
43 |
25 |
|
American public |
82 |
74 |
78 |
|
Judicial branch |
75 |
64 |
65 |
|
Local government |
75 |
63 |
72 |
|
Public officials |
67 |
51 |
58 |
|
Legislative branch |
67 |
56 |
65 |
|
State government |
66 |
66 |
67 |
|
News/Mass media |
31 |
49 |
70 |
Survey Methods
These results are based on telephone interviews with a randomly selected national sample of 921 adults, aged 18 and older, conducted Sept. 12-15, 2005. For results based on this sample, one can say with 95% confidence that the maximum error attributable to sampling and other random effects is ±4 percentage points. In addition to sampling error, question wording and practical difficulties in conducting surveys can introduce error or bias into the findings of public opinion polls.
13. Now I'd like to ask you several questions about our governmental system. First, how much trust and confidence do you have in our federal government in Washington when it comes to handling [Read A-B] -- a great deal, a fair amount, not very much, or none at all?
A. International Problems
|
|
Great |
Fair |
Not very |
None |
No |
|
% |
% |
% |
% |
% |
|
|
2005 Sep 12-15 |
14 |
42 |
33 |
11 |
* |
|
|
|
|
|
|
|
|
2005 Feb 7-10 |
14 |
48 |
31 |
7 |
* |
|
2004 Sep 13-15 |
18 |
45 |
28 |
8 |
1 |
|
2004 Feb 9-12 |
14 |
48 |
29 |
9 |
* |
|
2003 Sep 8-10 |
16 |
47 |
27 |
9 |
1 |
|
2003 Jul 18-20 |
17 |
52 |
25 |
5 |
1 |
|
2003 Feb 3-6 |
17 |
56 |
20 |
6 |
1 |
|
2002 Sep 5-8 |
18 |
53 |
22 |
6 |
1 |
|
2002 Jun 17-19 |
21 |
54 |
18 |
6 |
1 |
|
2002 Feb 4-6 |
21 |
60 |
14 |
4 |
1 |
|
2001 Oct 11-14 |
36 |
47 |
13 |
3 |
1 |
|
2001 Sep 7-10 |
14 |
54 |
25 |
6 |
1 |
|
2001 Feb 1-4 |
12 |
63 |
19 |
4 |
2 |
|
2000 Jul 6-9 |
17 |
55 |
21 |
6 |
1 |
|
2000 May 18-21 |
8 |
45 |
34 |
12 |
1 |
|
1998 Dec 28-29 |
9 |
52 |
30 |
7 |
2 |
|
1997 May 30-Jun 1 |
10 |
58 |
23 |
7 |
2 |
|
1976 Jun |
8 |
48 |
33 |
7 |
4 |
|
1974 Apr |
24 |
49 |
18 |
4 |
3 |
|
1972 May |
20 |
55 |
20 |
2 |
4 |
|
* Less than 0.5% |
|||||
B. Domestic Problems
|
|
Great |
Fair |
Not very |
None |
No |
|
% |
% |
% |
% |
% |
|
|
2005 Sep 12-15 |
10 |
43 |
35 |
11 |
1 |
|
|
|
|
|
|
|
|
2005 Feb 7-10 |
9 |
47 |
35 |
8 |
1 |
|
2004 Sep 13-15 |
13 |
48 |
31 |
7 |
1 |
|
2004 Feb 9-12 |
9 |
50 |
30 |
10 |
1 |
|
2003 Sep 8-10 |
9 |
49 |
32 |
9 |
1 |
|
2003 Jul 18-20 |
14 |
50 |
29 |
7 |
* |
|
2003 Feb 3-6 |
11 |
52 |
28 |
7 |
2 |
|
2002 Sep 5-8 |
11 |
52 |
28 |
7 |
2 |
|
2002 Jun 17-19 |
13 |
54 |
23 |
8 |
2 |
|
2002 Feb 4-6 |
12 |
59 |
23 |
5 |
1 |
|
2001 Oct 11-14 |
24 |
53 |
17 |
4 |
2 |
|
2001 Sep 7-10 |
6 |
54 |
31 |
8 |
1 |
|
2001 Feb 1-4 |
7 |
56 |
28 |
8 |
1 |
|
2000 Jul 6-9 |
10 |
48 |
30 |
10 |
2 |
|
2000 May 18-21 |
11 |
54 |
26 |
7 |
2 |
|
1998 Dec 28-29 |
11 |
54 |
26 |
7 |
2 |
|
1997 May 30-Jun 1 |
6 |
45 |
36 |
11 |
2 |
|
1976 Jun |
5 |
44 |
42 |
7 |
3 |
|
1974 Apr |
9 |
42 |
36 |
8 |
4 |
|
1972 May |
11 |
59 |
26 |
3 |
2 |
|
* Less than 0.5% |
|||||
14. As you know, our federal government is made up of three branches: an executive branch, headed by the president; a judicial branch, headed by the U.S. Supreme Court; and a legislative branch, made up of the U.S. Senate and House of Representatives. First, let me ask you how much trust and confidence you have at this time in the executive branch headed by the president, the judicial branch headed by the U.S. Supreme Court, and the legislative branch, consisting of the U.S. Senate and House of Representatives -- a great deal, a fair amount, not very much, or none at all?
A. The Executive branch headed by the President
|
|
Great |
Fair |
Not very |
None |
No |
|
% |
% |
% |
% |
% |
|
|
2005 Sep 12-15 |
19 |
33 |
30 |
18 |
* |
|
|
|
|
|
|
|
|
2004 Sep 13-15 |
31 |
27 |
25 |
16 |
1 |
|
2003 Sep 8-10 |
25 |
35 |
26 |
14 |
* |
|
2002 Sep 5-8 |
28 |
44 |
20 |
7 |
1 |
|
2001 Sep 7-10 |
21 |
42 |
28 |
8 |
1 |
|
2000 Jul 6-9 |
18 |
47 |
23 |
11 |
1 |
|
1999 Feb 4-8 |
21 |
43 |
24 |
11 |
1 |
|
1998 Dec 28-29 |
24 |
39 |
23 |
12 |
2 |
|
1997 May 30-Jun 1 |
13 |
49 |
27 |
9 |
2 |
|
1976 Jun |
13 |
45 |
30 |
9 |
4 |
|
1974 Apr |
12 |
28 |
36 |
20 |
3 |
|
1972 May |
24 |
49 |
20 |
4 |
2 |
|
* Less than 0.5% |
|||||
B. The Judicial branch, headed by the U.S. Supreme Court
|
|
Great |
Fair |
Not very |
None |
No |
|
% |
% |
% |
% |
% |
|
|
2005 Sep 12-15 |
13 |
55 |
25 |
6 |
1 |
|
|
|
|
|
|
|
|
2004 Sep 13-15 |
14 |
51 |
27 |
6 |
2 |
|
2003 Sep 8-10 |
13 |
54 |
27 |
5 |
1 |
|
2002 Sep 5-8 |
17 |
58 |
18 |
5 |
2 |
|
2001 Sep 7-10 |
17 |
57 |
20 |
4 |
2 |
|
2000 Jul 6-9 |
23 |
52 |
18 |
6 |
1 |
|
1999 Feb 4-8 |
29 |
51 |
13 |
5 |
2 |
|
1998 Dec 28-29 |
27 |
51 |
16 |
4 |
2 |
|
1997 May 30-Jun 1 |
19 |
52 |
22 |
5 |
2 |
|
1976 Jun |
16 |
47 |
26 |
6 |
4 |
|
1974 Apr |
17 |
54 |
20 |
5 |
5 |
|
1972 May |
17 |
49 |
24 |
7 |
4 |
C. The Legislative branch, consisting of the U.S. Senate and House of Representatives
|
|
Great |
Fair |
Not very |
None |
No |
|
|
% |
% |
% |
% |
% |
||
|
2005 Sep 12-15 |
8 |
54 |
31 |
6 |
1 |
|
|
|
|
|
|
|
||
|
2004 Sep 13-15 |
7 |
53 |
33 |
6 |
1 |
|
|
2003 Sep 8-10 |
8 |
55 |
31 |
5 |
1 |
|
|
2002 Sep 5-8 |
9 |
58 |
26 |
6 |
1 |
|
|
2001 Sep 7-10 |
7 |
58 |
28 |
6 |
1 |
|
|
2000 Jul 6-9 |
11 |
57 |
24 |
7 |
1 |
|
|
1999 Feb 4-8 |
8 |
49 |
34 |
7 |
2 |
|
|
1998 Dec 28-29 |
13 |
48 |
30 |
7 |
2 |
|
|
1997 May 30-Jun 1 |
6 |
48 |
36 |
8 |
2 |
|
|
1976 Jun |
9 |
52 |
31 |
6 |
4 |
|
|
1974 Apr |
13 |
55 |
24 |
4 |
4 |
|
|
1972 May |
13 |
58 |
22 |
3 |
3 |
|
15. How much trust and confidence do you have in the government of the state where you live when it comes to handling state problems -- a great deal, a fair amount, not very much, or none at all?
|
|
Great |
Fair |
Not very |
None |
No |
|
% |
% |
% |
% |
% |
|
|
2005 Sep 12-15 |
17 |
50 |
26 |
7 |
* |
|
|
|
|
|
|
|
|
2004 Sep 13-15 |
16 |
51 |
24 |
8 |
1 |
|
2003 Sep 8-10 |
12 |
41 |
34 |
12 |
1 |
|
2001 Sep 7-10 |
17 |
48 |
27 |
7 |
1 |
|
1998 Dec 28-29 |
29 |
51 |
15 |
4 |
1 |
|
1997 May 30-Jun 1 |
18 |
50 |
25 |
6 |
1 |
|
1976 Jun |
13 |
59 |
19 |
7 |
2 |
|
1974 Apr |
16 |
59 |
17 |
3 |
4 |
|
1972 May |
15 |
48 |
27 |
6 |
3 |
|
* Less than 0.5% |
|||||
16. And how much trust and confidence do you have in the local governments in the area where you live when it comes to handling local problems -- a great deal, a fair amount, not very much, or none at all?
|
|
Great |
Fair |
Not very |
None |
No |
|
% |
% |
% |
% |
% |
|
|
2005 Sep 12-15 |
23 |
47 |
23 |
7 |
* |
|
|
|
|
|
|
|
|
2004 Sep 13-15 |
21 |
47 |
24 |
7 |
1 |
|
2003 Sep 8-10 |
18 |
50 |
23 |
8 |
1 |
|
2001 Sep 7-10 |
19 |
50 |
20 |
10 |
1 |
|
1998 Dec 28-29 |
23 |
54 |
16 |
5 |
2 |
|
1997 May 30-Jun 1 |
21 |
48 |
21 |
7 |
2 |
|
1976 Jun |
13 |
52 |
23 |
9 |
3 |
|
1974 Apr |
16 |
55 |
16 |
8 |
5 |
|
1972 May |
12 |
51 |
26 |
7 |
4 |
|
* Less than 0.5% |
|||||
17. In general, how much trust and confidence do you have in the mass media -- such as newspapers, T.V., and radio -- when it comes to reporting the news fully, accurately, and fairly -- a great deal, a fair amount, not very much, or none at all?
|
|
Great |
Fair |
Not very |
None |
No |
|
% |
% |
% |
% |
% |
|
|
2005 Sep 12-15 |
13 |
37 |
37 |
12 |
1 |
|
|
|
|
|
|
|
|
2004 Sep 13-15 |
9 |
35 |
39 |
16 |
1 |
|
2003 Sep 8-10 |
14 |
40 |
35 |
11 |
* |
|
2002 Sep 5-8 |
10 |
44 |
35 |
11 |
* |
|
2001 Sep 7-10 |
12 |
41 |
33 |
14 |
* |
|
2000 Jul 6-9 |
12 |
39 |
37 |
12 |
* |
|
1999 Feb 4-8 |
11 |
44 |
34 |
11 |
* |
|
1998 Dec 28-29 |
11 |
44 |
35 |
9 |
1 |
|
1997 May 30-Jun 1 |
10 |
43 |
31 |
15 |
1 |
|
1976 Jun |
18 |
54 |
22 |
4 |
2 |
|
1974 Apr |
21 |
48 |
21 |
8 |
2 |
|
1972 May |
18 |
50 |
24 |
6 |
2 |
|
* Less than 0.5% |
|||||
18. How much trust and confidence do you have in general in men and women in political life in this country who either hold or are running for public office -- a great deal, a fair amount, not very much, or none at all?
|
|
Great |
Fair |
Not very |
None |
No |
|
% |
% |
% |
% |
% |
|
|
2005 Sep 12-15 |
4 |
54 |
35 |
5 |
2 |
|
|
|
|
|
|
|
|
2004 Sep 13-15 |
6 |
57 |
32 |
3 |
2 |
|
2003 Sep 8-10 |
5 |
54 |
36 |
4 |
1 |
|
2002 Sep 5-8 |
6 |
54 |
33 |
6 |
1 |
|
2001 Sep 7-10 ^ |
4 |
51 |
39 |
6 |
* |
|
2000 Jul 6-9 |
7 |
57 |
31 |
3 |
2 |
|
1998 Dec 28-29 |
7 |
56 |
31 |
4 |
2 |
|
1997 May 30-Jun 1 |
5 |
52 |
37 |
5 |
1 |
|
1976 Jun |
6 |
58 |
28 |
4 |
4 |
|
1974 Apr |
7 |
61 |
24 |
4 |
4 |
|
1972 May |
7 |
58 |
27 |
5 |
2 |
|
|
|
|
|
|
|
|
* Less than 0.5% |
|||||
|
^ Asked of a half sample |
|||||
19. More generally, how much trust and confidence do you have in the American people as a whole when it comes to making judgments under our democratic system about the issues facing our country -- a great deal, a fair amount, not very much, or none at all?
|
|
Great |
Fair |
Not very |
None |
No |
|
% |
% |
% |
% |
% |
|
|
2005 Sep 12-15 |
22 |
56 |
19 |
3 |
* |
|
|
|
|
|
|
|
|
2004 Sep 13-15 |
21 |
54 |
22 |
2 |
1 |
|
2003 Sep 8-10 |
24 |
52 |
21 |
2 |
1 |
|
2002 Sep 5-8 |
23 |
55 |
17 |
4 |
1 |
|
2001 Sep 7-10 |
17 |
57 |
22 |
3 |
1 |
|
1976 Jun |
25 |
61 |
12 |
1 |
2 |
|
1974 Apr |
27 |
56 |
13 |
2 |
3 |
