GALLUP NEWS SERVICE
PRINCETON, NJ -- Three years ago, President Clinton used his
State of the Union address to drive home the point to Americans
that the nation's economic engine was running at full speed and
that the federal budget deficit had been wiped out for the first
time in more than a quarter century. These facts had already been
widely reported, but the speech
Americans' enthusiasm about the country's state of affairs has not held at that level. Nevertheless, a Gallup poll conducted January 10-14, just prior to the inauguration of George W. Bush, finds a majority of Americans still satisfied with the way things are going in the country. Fifty-six percent of Americans are satisfied with the way things are going in the United States overall, while 41% are dissatisfied. Similarly, when respondents are asked to rate the state of the nation on a zero-to-ten scale, 54% register positive evaluations, ranging from 7-10, while 42% are more subdued, rating it only 4, 5 or 6. (Very few are highly negative today, with only 2% of the public saying the country currently stands at 0-3 on this scale.)
Americans appear even more upbeat about public affairs when they reflect on matters closer to home. Nearly two-thirds of the nation's adults, 65%, are currently satisfied with the way things are going in the state in which they reside, and three-quarters, 76%, are satisfied with their local community.
Economic Concerns May Be Dampening Outlook
The generally positive evaluations about the country, overall, can
be placed in both historical and economic contexts.
First, the public's satisfaction with the way things are going in the country is down compared to the twin peaks of 63% recorded in January 1998 and 71% in January 1999. However, both of these spikes were temporary; using this measure, the average satisfaction with the country since 1998 has been only 59% or 60%, not dissimilar to the 56% recorded today. And the current satisfaction level is much higher than it was during most of the past two decades. So, these remain very good times by comparison.
What Gallup polls do reflect now that is different from the recent past is a distinct lack of optimism about the future. This is seen in Americans' forecast for where the country will stand five years from now -- using the same zero-to-ten scale on which respondents are asked to evaluate current circumstances. Fifty-five percent of Americans say the country will be in positive territory five years from now (defined as a seven-to-ten rating on this scale), nearly identical to the 54% who rate the country this well today. This differs from previous years, when Gallup found Americans tending to rate the future more positively than the present. For instance, in 1991, only 37% rated current conditions from 7-10, but 46% rated the future that positively. Similarly, in 1959, when 54% rated the nation from 7-10, the same as today's rating, 66% rated the future that highly as well.
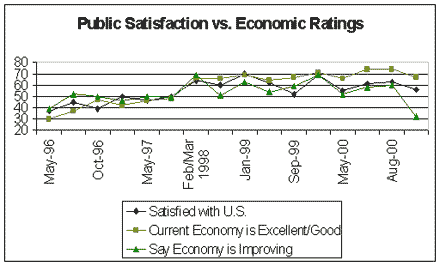
One likely reason for the cautious view that Americans currently express about the future is their newfound concern over the economy. While two-thirds currently believe the economy is in "excellent" or "good" shape, a majority believe the U.S. economy is getting worse rather than better -- for the first time since 1992. Also, 56% of the public now say economic conditions are getting worse, up from 48% last month, 38% in November and only 23% last January. Only 32% currently believe conditions are improving, down from 69% a year ago.
So far, this pessimism has resulted in no discernable impact on Americans' evaluation of current economic conditions -- with most of the public believing the economy is in excellent or good shape. Two-thirds of Americans feel positively about the economy today, similar to the 71% recorded a year ago. However, the recent drop in the economic outlook -- from 60% who said last summer that economic conditions were improving to just 32% who feel that positively today -- is something to watch. As the chart below shows, the overall satisfaction Americans express with the country, their evaluation of current economic conditions, and their outlook for the economy have all tracked fairly closely for the past four years. The significant decline solely in economic outlook is highly discordant with the previous pattern -- suggesting either that the other two indicators may follow suit, with potentially serious consequences for consumer confidence and the country, or that the decline in Americans' economic outlook is only a temporary phenomenon. Stay tuned.
Survey Methods
The results below are based on telephone interviews with a randomly selected national sample of 1,004 adults, 18 years and older, conducted January 10-14, 2001. For results based on this sample, one can say with 95 percent confidence that the maximum error attributable to sampling and other random effects is plus or minus 3 percentage points. In addition to sampling error, question wording and practical difficulties in conducting surveys can introduce error or bias into the findings of public opinion polls.
In general, are you satisfied or dissatisfied with the way things are going in the United States at this time?
|
|
Dis- |
No |
|
Dis- |
No |
||||
|
2001 Jan 10-14 |
56 |
41 |
3 |
1994 Mar 25-27 |
35 |
62 |
3 |
||
|
1994 Feb 26-28 |
36 |
61 |
3 |
||||||
|
2000 Dec 2-4 |
51 |
46 |
3 |
1994 Jan 15-17 |
35 |
62 |
3 |
||
|
2000 Nov 13-15 |
58 |
41 |
1 |
1993 Dec 4-6 |
34 |
63 |
3 |
||
|
2000 Oct 6-9 |
62 |
36 |
2 |
1993 Nov 2-4 |
27 |
70 |
3 |
||
|
2000 Aug 29-Sep 5 |
59 |
38 |
3 |
1993 May 21-23 |
24 |
73 |
3 |
||
|
2000 Aug 18-19 |
63 |
33 |
4 |
1993 Feb 12-14 |
25 |
71 |
4 |
||
|
2000 Jul 14-16 |
61 |
35 |
4 |
1993 Jan 8-11 |
29 |
68 |
3 |
||
|
2000 Jun 22-25 |
56 |
39 |
5 |
1992 Nov 10-11 |
26 |
68 |
6 |
||
|
2000 May 18-21 |
55 |
42 |
3 |
1992 Aug 28-Sep 2 ‡ |
22 |
73 |
5 |
||
|
2000 Apr 3-9 |
59 |
37 |
4 |
1992 June 12-14 |
14 |
84 |
2 |
||
|
2000 Feb 25-27 |
65 |
32 |
3 |
1992 May 7-10 |
20 |
77 |
3 |
||
|
2000 Jan 7-10 |
69 |
28 |
3 |
1992 Apr 20-22 ^ |
19 |
80 |
1 |
||
|
1999 Sep 23-26 |
52 |
45 |
3 |
1992 Feb 28-Mar 1 |
21 |
78 |
1 |
||
|
1999 Aug 24-26 |
62 |
35 |
3 |
1992 Jan 31-Feb 2 ^ |
24 |
75 |
1 |
||
|
1999 Jun 11-13 |
55 |
42 |
3 |
1992 Jan 3-6 ^ |
24 |
74 |
2 |
||
|
1999 May 23-24 |
51 |
46 |
3 |
1991 Dec |
37 |
60 |
3 |
||
|
1999 Apr 26-27 |
51 |
45 |
4 |
1991 Nov |
35 |
62 |
3 |
||
|
1999 Apr 13-14 |
58 |
39 |
3 |
1991 Oct |
39 |
57 |
4 |
||
|
1999 Feb 12-13 |
71 |
26 |
3 |
1991 Aug |
49 |
45 |
5 |
||
|
1999 Jan 15-17 |
70 |
28 |
2 |
1991 Mar 21-24 |
52 |
43 |
5 |
||
|
1998 Dec 28-29 |
50 |
48 |
2 |
1991 Feb 28-Mar 3 |
66 |
31 |
3 |
||
|
1998 Oct 29-Nov 1 |
60 |
34 |
6 |
1991 Feb |
54 |
40 |
6 |
||
|
1998 Aug 21-23 |
63 |
34 |
3 |
1991 Jan 17-20 |
62 |
33 |
5 |
||
|
1998 Aug 10-12 |
60 |
36 |
4 |
1991 Jan 3-6 |
32 |
61 |
7 |
||
|
1998 May 8-10 |
59 |
36 |
5 |
1990 Oct 25-28 |
31 |
66 |
3 |
||
|
1998 Apr 17-19 |
58 |
38 |
4 |
1990 Oct 11-14 |
29 |
67 |
4 |
||
|
1998 Feb 20-22 |
64 |
32 |
4 |
1990 Sep |
37 |
58 |
5 |
||
|
1998 Feb 13-15 |
59 |
37 |
4 |
1990 Aug-Sep |
51 |
44 |
5 |
||
|
1998 Jan 30-Feb 1 |
63 |
35 |
2 |
1990 Aug |
43 |
51 |
6 |
||
|
1997 Dec 18-21 |
50 |
46 |
4 |
1990 Jul |
45 |
51 |
4 |
||
|
1997 Aug 22-25 |
50 |
48 |
2 |
1990 Feb |
55 |
39 |
6 |
||
|
1997 May 6-7 |
46 |
51 |
3 |
1989 Feb |
45 |
50 |
5 |
||
|
1997 Jan 10-13 |
50 |
47 |
3 |
1988 Sep |
56 |
40 |
4 |
||
|
1996 Dec 9-11 |
43 |
55 |
2 |
1988 May |
41 |
54 |
5 |
||
|
1996 Nov 21-24 |
47 |
47 |
6 |
1987 Aug |
45 |
49 |
6 |
||
|
1996 Oct 26-29 |
39 |
56 |
5 |
1986 Dec † |
47 |
49 |
4 |
||
|
1996 Aug 30-Sep 1 |
45 |
50 |
5 |
1986 Sep |
58 |
38 |
4 |
||
|
1996 Aug 16-18 |
38 |
57 |
5 |
1986 Mar |
66 |
30 |
4 |
||
|
1996 May 9-12 |
37 |
60 |
3 |
1985 Nov |
51 |
46 |
3 |
||
|
1996 Mar 15-17 |
36 |
61 |
3 |
1984 Dec |
52 |
40 |
8 |
||
|
1996 Mar 8-10 |
41 |
56 |
3 |
1984 Sep |
48 |
45 |
7 |
||
|
1996 Jan 5-7 |
24 |
72 |
4 |
1984 Feb |
50 |
46 |
4 |
||
|
1995 Aug 11-14 |
33 |
64 |
3 |
1983 Aug |
35 |
59 |
6 |
||
|
1995 Jul 7-9 |
32 |
65 |
3 |
1982 Nov |
24 |
72 |
4 |
||
|
1995 Mar 27-29 |
30 |
66 |
4 |
1982 Apr |
25 |
71 |
4 |
||
|
1994 Nov 28-29 |
29 |
67 |
4 |
1981 Dec |
27 |
67 |
6 |
||
|
1994 Nov 2-6 |
30 |
66 |
4 |
1981 Jun |
33 |
61 |
6 |
||
|
1994 Oct 22- 25 |
31 |
66 |
3 |
1981 Jan |
17 |
78 |
5 |
||
|
1994 Jul 15-17 |
33 |
65 |
2 |
1979 Nov |
19 |
77 |
4 |
||
|
1994 May 20-22 |
33 |
64 |
3 |
1979 Jul |
12 |
84 |
4 |
||
|
1994 Apr 22-24 |
32 |
65 |
3 |
1979 Feb |
26 |
69 |
5 |
||
|
^ registered voters † Gallup/Newsweek ‡ Gallup/CNN/Knight-Ridder |
|||||||||
We'd like you to imagine a ladder with steps numbered from zero at the bottom to ten at the top. Suppose the top of the ladder represents the best possible situation for our country and the bottom represents the worst possible situation. Please tell me the number of the step on which you think the United States stands at the present time?
|
Worst 0 |
1 |
2 |
3 |
4 |
5 |
6 |
7 |
8 |
9 |
Best |
No opinion |
7-10 |
|
|
2001 Jan 10-14 |
* |
* |
1 |
1 |
5 |
18 |
19 |
31 |
16 |
4 |
3 |
2 |
54 |
|
1991 May 23-26 |
1 |
1 |
3 |
5 |
10 |
24 |
16 |
17 |
11 |
3 |
6 |
3 |
37 |
|
1985 Mar 8-11 |
1 |
1 |
1 |
5 |
12 |
22 |
19 |
22 |
10 |
4 |
2 |
3 |
38 |
|
1979 Aug 10-13 |
1 |
1 |
5 |
12 |
16 |
28 |
16 |
11 |
5 |
1 |
1 |
2 |
18 |
|
1974 Apr † |
4 |
4 |
7 |
11 |
16 |
23 |
14 |
9 |
4 |
2 |
4 |
3 |
19 |
|
1972 May † |
1 |
2 |
4 |
9 |
12 |
25 |
14 |
15 |
9 |
2 |
5 |
2 |
31 |
|
1971 Jan 8-11 † |
1 |
1 |
3 |
11 |
12 |
28 |
14 |
12 |
7 |
3 |
3 |
5 |
25 |
|
1959 Aug ‡ |
1 |
* |
1 |
4 |
6 |
19 |
14 |
19 |
17 |
7 |
11 |
1 |
54 |
|
† Gallup/Potomac |
|||||||||||||
|
‡ Gallup/Institute for International Social Research |
|||||||||||||
What is the number of the step on which you think the U.S. stood about five years ago?
|
Worst 0 |
1 |
2 |
3 |
4 |
5 |
6 |
7 |
8 |
9 |
Best |
No opinion |
7-10 |
|
|
2001 Jan 10-14 |
* |
* |
1 |
4 |
6 |
23 |
17 |
15 |
19 |
7 |
4 |
4 |
45 |
|
1991 May 23-26 |
1 |
1 |
3 |
5 |
11 |
22 |
15 |
17 |
13 |
3 |
4 |
5 |
37 |
|
1985 Mar 8-11 |
1 |
1 |
5 |
11 |
18 |
20 |
17 |
13 |
7 |
3 |
2 |
3 |
25 |
|
1979 Aug 10-13 |
0 |
3 |
2 |
5 |
9 |
17 |
17 |
19 |
16 |
7 |
3 |
3 |
45 |
|
1974 Apr ^ |
1 |
2 |
4 |
4 |
8 |
17 |
16 |
20 |
15 |
7 |
5 |
1 |
47 |
|
1972 May ^ |
1 |
2 |
4 |
6 |
14 |
21 |
16 |
14 |
10 |
5 |
4 |
3 |
33 |
|
1971 Jan 8-11 ^ |
* |
1 |
2 |
6 |
9 |
18 |
16 |
19 |
15 |
6 |
5 |
4 |
45 |
|
1959 Aug † |
1 |
1 |
2 |
6 |
10 |
15 |
13 |
17 |
16 |
5 |
10 |
6 |
48 |
|
^ Gallup/Potomac |
|||||||||||||
|
† Gallup/Institute for International Social Research |
|||||||||||||
And just your best guess, if things go pretty much as you now expect, what is the number of the step on which you think the U.S. will stand, about five years from now?
|
Worst 0 |
1 |
2 |
3 |
4 |
5 |
6 |
7 |
8 |
9 |
Best |
No opinion |
7-10 |
|
|
2001 Jan 10-14 |
1 |
1 |
3 |
4 |
7 |
13 |
12 |
16 |
23 |
10 |
6 |
4 |
55 |
|
1991 May 23-26 |
3 |
3 |
4 |
7 |
6 |
13 |
10 |
14 |
17 |
7 |
8 |
8 |
46 |
|
1985 Mar 8-11 |
2 |
1 |
3 |
6 |
5 |
10 |
11 |
17 |
20 |
12 |
5 |
8 |
54 |
|
1979 Aug 10-13 |
* |
8 |
6 |
7 |
10 |
12 |
12 |
12 |
13 |
6 |
5 |
9 |
36 |
|
1974 Apr ^ |
5 |
4 |
5 |
6 |
7 |
11 |
9 |
12 |
14 |
8 |
9 |
10 |
43 |
|
1972 May ^ |
2 |
3 |
3 |
8 |
7 |
9 |
11 |
12 |
16 |
11 |
10 |
8 |
49 |
|
1971 Jan 8-11 ^ |
2 |
3 |
4 |
6 |
6 |
10 |
10 |
14 |
15 |
9 |
8 |
13 |
46 |
|
1959 Aug † |
1 |
1 |
2 |
3 |
3 |
8 |
8 |
14 |
18 |
13 |
21 |
8 |
66 |
|
^Gallup/Potomac |
|||||||||||||
|
† Gallup/Institute for International Social Research |
|||||||||||||
In general, are you satisfied or dissatisfied with the way things are going in your state at this time?
|
Satisfied |
Dissatisfied |
No opinion |
|
|
2001 Jan 10-14 |
65% |
33 |
2 |
|
1995 Jul 7-9 |
50% |
46 |
4 |
All in all, are you satisfied or dissatisfied with the way things are going in your local community?
|
Satisfied |
Dissatisfied |
No opinion |
|
|
2001 Jan 10-14 |
76% |
22 |
2 |
* Less than 0.5%