GALLUP NEWS SERVICE
PRINCETON, NJ -- It appears that Americans have become more hostile toward Congress. Approval of the job Congress has been doing has drifted down to below 30% in Gallup's monthly measures, and a recent CNN/USA Today/Gallup poll shows that the percentage of Americans who say that most members of Congress should be re-elected is as low as it has been in more than a decade.
There are of course plenty of proximate causes for this general dissatisfaction, including most recently the Jack Abramoff lobbying scandal, the resignation of California Congressman Randy Cunningham after revelations that he accepted bribes, and the swirling controversy surrounding former House Majority leader Tom DeLay.
The most recent poll asks if "most" members of Congress deserve re-election this year. The Jan. 6-8 poll shows that just 42% of Americans say yes, while 47% say no.
Please tell me whether you think each of the following political office-holders deserves to be re-elected, or not. How about -- [ROTATED]?
Most members of Congress
|
Yes, deserves |
No, |
No opinion |
|
Yes, deserves |
No, |
No opinion |
||
|
National Adults |
% |
% |
% |
|
Registered Voters |
% |
% |
% |
|
2006 Jan 6-8 |
42 |
47 |
11 |
|
2006 Jan 6-8 |
43 |
47 |
10 |
|
|
|
|
|
|
|
|
||
|
2005 Oct 21-23 |
45 |
44 |
11 |
|
2005 Oct 21-23 |
46 |
44 |
10 |
|
2004 Oct 14-16 |
51 |
33 |
16 |
|
2004 Oct 14-16 |
51 |
34 |
15 |
|
2003 Oct 10-12 |
51 |
35 |
14 |
|
2003 Oct 10-12 |
50 |
37 |
13 |
|
2002 Sep 20-22 |
57 |
28 |
15 |
|
2002 Sep 20-22 |
57 |
29 |
14 |
|
2002 Apr 29-May 1 |
58 |
22 |
20 |
|
2002 Apr 29-May 1 |
57 |
24 |
19 |
|
2001 Aug 24-26 |
51 |
31 |
18 |
|
2001 Aug 24-26 |
52 |
30 |
18 |
|
2000 Jan 7-10 |
55 |
31 |
14 |
|
2000 Sep 11-13 |
54 |
30 |
16 |
|
1998 Oct 9-12 |
58 |
26 |
16 |
|
2000 Jan 7-10 |
56 |
31 |
13 |
|
1998 Apr 17-19 |
56 |
28 |
16 |
|
1998 Oct 9-12 |
58 |
27 |
15 |
|
1997 Oct 27-29 |
50 |
29 |
21 |
|
1998 Apr 17-19 |
55 |
29 |
16 |
|
1997 Aug 22-25 |
56 |
27 |
17 |
|
1994 Nov 2-6 |
38 |
47 |
15 |
|
1996 May 9-12 |
50 |
35 |
15 |
|
1994 Oct 22-25 |
43 |
45 |
12 |
|
1996 Jan 12-15 |
47 |
38 |
15 |
|
1994 Oct 7-9 |
37 |
49 |
14 |
|
1994 Nov 2-6 |
39 |
45 |
16 |
|
1994 Jul 15-17 |
40 |
46 |
14 |
|
1994 Oct 22-25 |
43 |
44 |
13 |
|
1994 Mar 25-27 |
46 |
38 |
16 |
|
1994 Oct 18-19 |
44 |
42 |
14 |
|
1994 Feb 26-28 |
42 |
44 |
14 |
|
1994 Oct 7-9 |
37 |
48 |
15 |
|
1992 Oct 23-25 |
29 |
50 |
21 |
|
1994 Jul 15-17 |
41 |
43 |
16 |
|
1992 Sep 11-15 |
32 |
46 |
22 |
|
1994 Mar 25-27 |
46 |
38 |
16 |
|
1992 Jul 31 Aug 2 |
40 |
46 |
14 |
|
1994 Feb 26-28 |
42 |
44 |
14 |
|
1992 Apr 20-22 |
33 |
50 |
17 |
|
1993 Dec 17-19 |
38 |
47 |
15 |
|
1992 Apr 9-12 |
32 |
53 |
15 |
|
1993 Jul 19-21 |
39 |
46 |
15 |
|
1992 Mar 20-22 |
31 |
58 |
11 |
|
1991 Nov |
38 |
48 |
14 |
|
1992 Jan 31-Feb 2 |
43 |
43 |
14 |
|
|
|
|
|
1992 Jan 3-9 |
43 |
42 |
15 |
|
|
|
|
|
|
|
|
|
||
|
|
|
|
|
Likely Voters |
|
|
|
|
|
|
|
|
|
2004 Oct 14-16 |
53 |
32 |
15 |
|
|
|
|
|
|
2002 Sep 20-22 |
57 |
31 |
12 |
|
|
|
|
|
|
2000 Sep 11-13 |
55 |
32 |
13 |
|
|
|
|
|
|
2000 Jan 7-10 |
57 |
31 |
12 |
|
|
|
|
|
|
1996 Oct 27-28 |
55 |
26 |
19 |
This is the lowest re-elect percentage Gallup has measured across the 15 times Gallup asked this question since November 1994, when just 39% said yes. That coincided with the 1994 mid-term congressional elections in which the Republicans wrested control of the House of Representatives from the Democrats after 40 years of Democratic control, marking one of the biggest shifts in the balance of power in the 20th century.
This general congressional re-elect percentage rose to the 50% range later in the 1990s, and stayed high after the Sept. 11 terrorist attacks, a time when most measures of public confidence in government increased. The measure dropped to 45% in October 2005 before sliding further to its current level today.
One could be excused for thinking that this low general congressional re-elect percentage will spell real trouble for incumbents during this fall's congressional elections. It certainly appears to have had that effect in 1994.
But other evidence from the recent poll suggests using some caution in assuming a major overthrow of Republican control of the House is brewing.
Despite the ebbs and flows of the public's views of Congress as an institution, the fact of the matter is that the public returns the vast majority of incumbent representatives seeking re-election to Congress back to office, election after election.
This is partly a function of redistricting patterns in recent decades, which have created safer congressional districts loaded with residents who tend to vote with one particular party or the other. It is also a function of the general rule of thumb that people are significantly more positive about the people and things they experience locally than they are about more generic institutions or conditions on a national level. People rate their local schools more positively than the nation's education system in general, their local access to healthcare more positively than their rating of the healthcare system in general, and so forth.
The current data reinforce this human tendency. While, as noted above, only 42% of Americans believe that most members of Congress should be re-elected, 60% in the same survey say that the U.S. Representative in "your congressional district" should be re-elected.
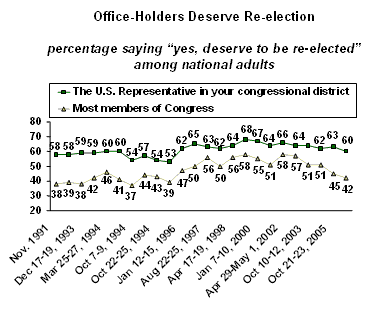
This same local congressional re-elect measure was at 53% in the November 1994 poll referenced previously. By way of summary, the "most members" re-election percentage today is 3 percentage points higher than it was in November 1994, while the local re-election percentage is 7 percentage points higher. Looked at differently, there was a 14 percentage-point spread between the local and general congressional re-elect percentages in 1994, while there is a 18 percentage-point difference today.
What does this tell us? It suggests first and foremost that the same patterns which pertained in 1994 are still relevant today. Voters were more supportive of their local Congress member then just as they are today. Second, the poll results show that both the general and the local re-elect percentages are at least slightly higher (and certainly not lower) now than they were in 1994. That, in turn, suggests that the same level of disgust with Congress is not (at least not yet) in place now as was the case in 1994.
Of course, the elections are more than 10 months away, and much can change.
Enthusiasm About Voting
One pattern was very clear in 1994. Republicans were much more enthusiastic about voting for mid-term elections than Democrats, by a 9 percentage-point margin in a November 1994 Gallup poll (44% of Republicans said they were more enthusiastic about voting than usual, compared to 35% of Democrats). This was, again, a time when Republicans reared up and took control of the House of Representatives.
What do we find today? Democrats and Republicans, at least as measured by this question, share roughly the same level of enthusiasm. Forty-eight percent of Democrats are more enthusiastic than usual, compared with 47% of Republicans.
It's worth emphasizing, however, that the overall percentage of Americans who say they are "more enthusiastic" about voting is as high as Gallup has measured during a mid-term election year in the last 12 years, and that Democrats have increased enthusiasm on a relative basis somewhat more than Republicans during that time.
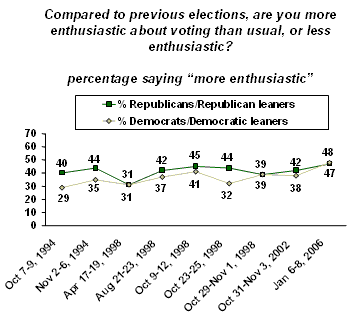
So while Democrats certainly are not at the point where they are significantly more enthusiastic about voting than Republicans (the reverse was true in 1994), there are some signs that voters are eager to go to the polls next fall -- and that Democrats' enthusiasm may be picking up at a higher rate than is the case for Republicans.
Generic Ballot
A great deal of water will flow under the dam between now and the November 2006 congressional elections, but at the moment the Democrats appear to have a slight edge against Republicans.
When Gallup asks Americans which party's candidate they would vote for in their congressional district, the generic Democratic candidate beats the Republican candidate by a 7 percentage-point margin (6 percentage points among registered voters).
If the elections for Congress were being held today, which party's candidate would you vote for in your congressional district -- [ROTATED: the Democratic Party's candidate or the Republican Party's candidate]? As of today, do you lean more toward -- [ROTATE: the Democratic Party's candidate or the Republican Party's candidate]?
|
Democratic |
Republican |
Undecided/ |
|
|
Registered Voters |
% |
% |
% |
|
2006 Jan 6-8 |
49 |
43 |
8 |
|
2005 Oct 21-23 |
50 |
43 |
7 |
|
2005 Aug 28-30 |
53 |
41 |
6 |
|
|
|
|
|
|
National Adults |
|
|
|
|
2006 Jan 6-8 |
49 |
42 |
9 |
|
2005 Oct 21-23 |
50 |
42 |
8 |
|
2005 Aug 28-30 |
52 |
41 |
7 |
Gallup asked this generic ballot question three times during the last year, and although the Democrats have won each time, the margin is actually decreasing rather than increasing.
Historically, the "generic ballot" has proven to be an accurate predictor of voting for the U.S. House of Representatives immediately before the election. At this point, the generic ballot gives a sense of how the election might turn out if the election were held today, and the Democrats at this point have the more favorable prospects.
Survey Methods
These results are based on telephone interviews with a randomly selected national sample of 1,003 adults, aged 18 and older, conducted Jan. 6-8, 2006. For results based on this sample, one can say with 95% confidence that the maximum error attributable to sampling and other random effects is ±3 percentage points. In addition to sampling error, question wording and practical difficulties in conducting surveys can introduce error or bias into the findings of public opinion polls.
3. Please tell me whether you think each of the following political office-holders deserves to be re-elected, or not. How about -- [ROTATED]?
A. The U.S. Representative in your Congressional District
|
Yes, deserves |
No, |
No opinion |
|
Yes, deserves |
No, |
No opinion |
||
|
National Adults |
% |
% |
% |
|
Registered Voters |
% |
% |
% |
|
2006 Jan 6-8 |
60 |
27 |
13 |
|
2006 Jan 6-8 |
62 |
26 |
12 |
|
|
|
|
|
|
|
|
||
|
2005 Oct 21-23 |
63 |
24 |
13 |
|
2005 Oct 21-23 |
65 |
24 |
11 |
|
2004 Oct 14-16 |
62 |
21 |
17 |
|
2004 Oct 14-16 |
63 |
21 |
16 |
|
2003 Oct 10-12 |
64 |
22 |
14 |
|
2003 Oct 10-12 |
65 |
24 |
11 |
|
2002 Sep 20-22 |
64 |
19 |
17 |
|
2002 Sep 20-22 |
67 |
19 |
14 |
|
2002 Apr 29-May 1 |
66 |
18 |
16 |
|
2002 Apr 29-May 1 |
67 |
19 |
14 |
|
2001 Aug 24-26 |
64 |
20 |
16 |
|
2001 Aug 24-26 |
67 |
20 |
13 |
|
2000 Jan 7-10 |
67 |
15 |
18 |
|
2000 Sep 11-13 |
66 |
19 |
15 |
|
1998 Oct 9-12 |
68 |
16 |
16 |
|
2000 Jan 7-10 |
70 |
16 |
14 |
|
1998 Apr 17-19 |
64 |
19 |
17 |
|
1998 Oct 9-12 |
69 |
17 |
14 |
|
1997 Oct 27-29 |
62 |
18 |
20 |
|
1998 Apr 17-19 |
65 |
21 |
14 |
|
1997 Aug 22-25 |
63 |
21 |
16 |
|
1994 Nov 2-6 |
54 |
30 |
16 |
|
1996 May 9-12 |
65 |
22 |
13 |
|
1994 Oct 22-25 |
55 |
32 |
13 |
|
1996 Jan 12-15 |
62 |
21 |
17 |
|
1994 Oct 7-9 |
55 |
30 |
15 |
|
1994 Nov 2-6 |
53 |
29 |
18 |
|
1994 Jul 15-17 |
61 |
28 |
11 |
|
1994 Oct 22-25 |
54 |
30 |
16 |
|
1994 Mar 25-27 |
60 |
23 |
17 |
|
1994 Oct 18-19 |
57 |
29 |
14 |
|
1994 Feb 26-28 |
59 |
28 |
13 |
|
1994 Oct 7-9 |
54 |
29 |
17 |
|
1992 Oct 23-25 |
48 |
30 |
22 |
|
1994 Jul 15-17 |
60 |
27 |
13 |
|
1992 Sep 11-15 |
54 |
25 |
21 |
|
1994 Mar 25-27 |
60 |
23 |
17 |
|
1992 Jul 31-Aug 2 |
61 |
25 |
14 |
|
1994 Feb 26-28 |
59 |
28 |
13 |
|
1992 Apr 20-22 |
50 |
31 |
19 |
|
1993 Dec 17-19 |
59 |
26 |
15 |
|
1992 Apr 9-12 |
58 |
29 |
13 |
|
1993 Nov 2-4 |
62 |
19 |
19 |
|
1992 Mar 20-22 |
56 |
30 |
14 |
|
1993 Jul 19-21 |
58 |
25 |
17 |
|
1992 Jan 31-Feb 2 |
64 |
24 |
12 |
|
1991 Nov |
58 |
25 |
17 |
|
1992 Jan 3-9 |
61 |
25 |
14 |
|
|
|
|
|
|
|
|
|
|
|
|
|
|
|
Likely Voters |
|
|
|
|
|
|
|
|
|
2004 Oct 14-16 |
69 |
19 |
12 |
|
|
|
|
|
|
2002 Sep 20-22 |
74 |
18 |
8 |
|
|
|
|
|
|
2000 Sep 11-13 |
70 |
20 |
10 |
|
|
|
|
|
|
2000 Jan 7-10 |
75 |
15 |
10 |
|
|
|
|
|
|
1996 Oct 27-28 |
62 |
19 |
19 |
4. Compared to previous elections, are you more enthusiastic about voting than usual, or less enthusiastic?
Trend for Mid-Term Elections
|
More |
Less |
|
No |
|
|
National Adults |
% |
% |
% |
% |
|
2006 Jan 6-8 |
45 |
39 |
14 |
1 |
|
2002 Oct 31-Nov 3 |
38 |
45 |
14 |
3 |
|
1998 Oct 29-Nov 1 |
37 |
46 |
14 |
3 |
|
1998 Oct 23-25 |
35 |
47 |
16 |
2 |
|
1998 Oct 9-12 |
35 |
47 |
16 |
2 |
|
1998 Aug 21-23 |
38 |
41 |
17 |
4 |
|
1998 Apr 17-19 |
30 |
48 |
19 |
3 |
|
1994 Nov 2-6 |
38 |
48 |
13 |
2 |
|
1994 Oct 7-9 |
34 |
46 |
18 |
2 |
|
|
|
|
|
|
|
Republicans/Republican Leaners |
|
|
|
|
|
2006 Jan 6-8 |
47 |
32 |
20 |
1 |
|
2002 Oct 31-Nov 3 |
42 |
42 |
15 |
1 |
|
1998 Oct 29-Nov 1 |
39 |
46 |
14 |
1 |
|
1998 Oct 23-25 |
44 |
39 |
16 |
1 |
|
1998 Oct 9-12 |
45 |
36 |
17 |
2 |
|
1998 Aug 21-23 |
42 |
39 |
17 |
2 |
|
1998 Apr 17-19 |
31 |
48 |
19 |
2 |
|
1994 Nov 2-6 |
44 |
44 |
11 |
1 |
|
1994 Oct 7-9 |
40 |
42 |
18 |
* |
|
|
|
|
|
|
|
Democrats/Democratic Leaners |
|
|
|
|
|
2006 Jan 6-8 |
48 |
44 |
7 |
1 |
|
2002 Oct 31-Nov 3 |
38 |
46 |
13 |
3 |
|
1998 Oct 29-Nov 1 |
39 |
44 |
15 |
2 |
|
1998 Oct 23-25 |
32 |
51 |
16 |
1 |
|
1998 Oct 9-12 |
41 |
45 |
13 |
1 |
|
1998 Aug 21-23 |
37 |
41 |
18 |
4 |
|
1998 Apr 17-19 |
31 |
48 |
19 |
2 |
|
1994 Nov 2-6 |
35 |
50 |
14 |
1 |
|
1994 Oct 7-9 |
29 |
50 |
18 |
3 |
|
|
|
|
|
|
|
Registered Voters |
|
|
|
|
|
2006 Jan 6-8 |
46 |
37 |
15 |
1 |
|
2002 Oct 31-Nov 3 |
41 |
42 |
15 |
2 |
|
1998 Oct 29-Nov 1 |
41 |
43 |
15 |
1 |
|
1998 Oct 23-25 |
37 |
44 |
18 |
1 |
|
1998 Oct 9-12 |
45 |
38 |
16 |
1 |
|
1998 Aug 21-23 |
39 |
39 |
19 |
3 |
|
1998 Apr 17-19 |
31 |
47 |
20 |
2 |
|
1994 Nov 2-6 |
40 |
45 |
14 |
1 |
|
1994 Oct 7-9 |
34 |
44 |
20 |
2 |