GALLUP NEWS SERVICE
PRINCETON, NJ -- Once again, Americans' perceptions of the U.S. economy have changed course and turned downward after a brief improvement. It's a pattern that has characterized consumer confidence for the last several years, and has produced a slight ratcheting down of consumer confidence since early 2004. The latest results are from an Aug. 13-16, 2007, survey, conducted before last Friday's stock market surge of 233 points.
Gallup saw a slight improvement in Americans' economic outlook in mid-July compared with June; during that time, the percentage rating current economic conditions as excellent or good rose from 34% to 40%, and the percentage perceiving economic conditions to be getting better increased from 23% to 29%. However, these gains were more than erased in the mid-August poll. The new poll finds current economic ratings down to 33% excellent or good and the percentage saying the economy is improving sinking to 20%. Both measures are now similar to where they were in mid-June.
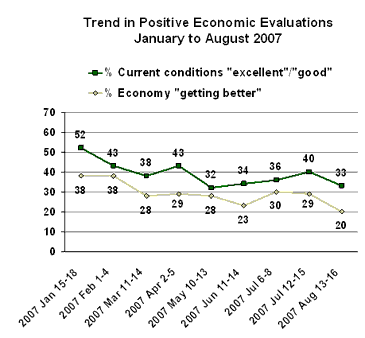
As seen in the longer-term trend in Gallup's economic measures, public confidence in the economy has been fluctuating in a fairly narrow range for most of George W. Bush's presidency. Positive sentiments about current economic conditions have rarely exceeded 40%, and optimism that the economy is improving has generally fallen under 50%. Periods of slightly improving perceptions have been consistently followed by a downturn, similar to that seen in the new poll.
Rising Pessimism
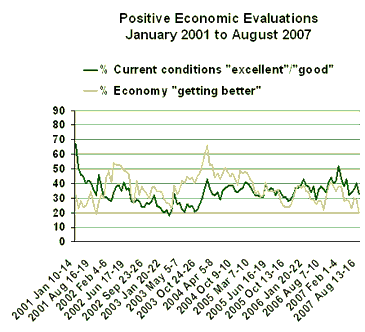
The 9-point decline since July -- from 29% to 20% -- in the percentage saying the economy is getting better is relatively steep for this measure, but not unprecedented. The measure fell by 10 points between February and March of this year, and rose by 9 points between last August and September.
The 72% now saying the economy is getting worse represents a record level of pessimism on this measure. The previous high was 71% (not statistically different from 72%) recorded in January 1992. Seventy percent of Americans said the economy was getting worse in June.
Stock Market Activity
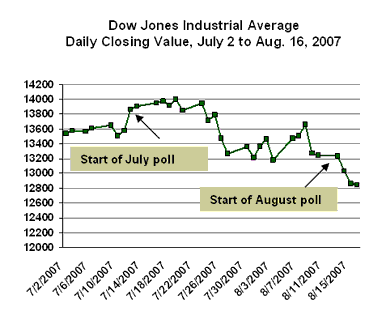
The downturn in Americans' economic confidence since July is very likely linked with the performance of the stock market. The Dow Jones Industrial Average registered a closing price of 13,862 at the start of the July 12-15 poll and broke the 14,000 barrier a week later. However, between then and the start of the latest poll, it fell more than 750 points, to 13,237. The stock market declined by an additional 391 points over the four-day span of the August survey; however, survey responses about the economy were just as negative on Day 1 of the poll as they were on Day 4. Thus, it appears that whatever the damage to consumer confidence since mid-July, it happened between July 15 and Aug. 13.
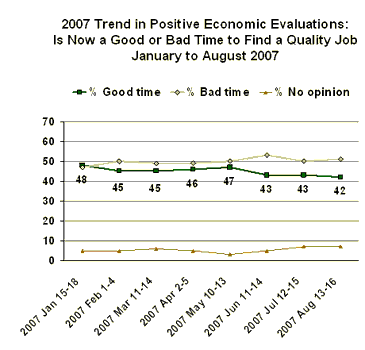
Major changes in the nation's leading employment reports have been known to send consumer confidence either soaring or south, but the recent news on that front has been quiet, and is thus not likely a factor in the latest confidence slump. The new poll finds perceptions of the job market essentially unchanged compared with June and July, with just more than 4 in 10 Americans saying now is a good time to find a quality job.
Also, Gallup's monthly measure of the "most important problem" facing the nation shows no significant changes in any single economic issue, such as employment, inflation, or gas prices.
Bottom Line
Americans are showing increased concern about the nation's economy, particularly in terms of their outlook. The 72% saying the economy is getting worse is numerically the highest Gallup has seen since instituting this question in 1991. However, the current economic ratings are generally similar to several periods of minimal confidence in recent years, including one just two months ago. The timing of the latest downturn in ratings and the lack of increased public concern about the job market or other economic issues suggest that major losses in the stock market over the past month are to blame.
Survey Methods
Results are based on telephone interviews with 1,019 national adults, aged 18 and older, conducted Aug. 13-16, 2007. For results based on the total sample of national adults, one can say with 95% confidence that the maximum margin of sampling error is ±3 percentage points.
In addition to sampling error, question wording and practical difficulties in conducting surveys can introduce error or bias into the findings of public opinion polls.
5. How would you rate economic conditions in this country today -- as excellent, good, only fair, or poor?
|
|
|
|
Only
|
|
No
|
|
2007 |
% |
% |
% |
% |
% |
|
2007 Aug 13-16 |
4 |
29 |
46 |
20 |
1 |
|
|
|
|
|
|
|
|
2007 Jul 12-15 |
8 |
32 |
40 |
20 |
* |
|
2007 Jul 6-8 |
8 |
28 |
42 |
21 |
* |
|
2007 Jun 11-14 |
5 |
29 |
43 |
23 |
* |
|
2007 May 10-13 |
4 |
28 |
45 |
23 |
* |
|
2007 Apr 2-5 |
8 |
35 |
40 |
18 |
* |
|
2007 Mar 11-14 |
6 |
32 |
47 |
15 |
* |
|
2007 Feb 1-4 |
8 |
35 |
41 |
16 |
* |
|
2007 Jan 15-18 |
11 |
41 |
33 |
15 |
* |
|
2006 |
|
|
|
|
|
|
2006 Dec 11-14 |
8 |
34 |
41 |
16 |
1 |
|
2006 Nov 9-12 |
8 |
32 |
43 |
16 |
-- |
|
2006 Oct 20-22 |
9 |
35 |
33 |
22 |
1 |
|
2006 Oct 9-12 |
7 |
34 |
42 |
16 |
1 |
|
2006 Sep 7-10 |
5 |
29 |
44 |
22 |
1 |
|
2006 Aug 7-10 |
5 |
31 |
43 |
21 |
* |
|
2006 Jul 6-9 |
5 |
33 |
42 |
19 |
1 |
|
2006 Jun 1-4 |
6 |
30 |
46 |
18 |
* |
|
2006 May 8-11 |
4 |
25 |
45 |
25 |
* |
|
2006 Apr 10-13 |
5 |
33 |
40 |
23 |
-- |
|
2006 Mar 13-16 |
4 |
30 |
45 |
20 |
1 |
|
2006 Feb 6-9 |
4 |
34 |
42 |
20 |
* |
|
2006 Jan 20-22 |
5 |
34 |
41 |
18 |
1 |
|
2006 Jan 9-12 |
8 |
35 |
37 |
18 |
1 |
|
2005 |
% |
% |
% |
% |
% |
|
2005 Dec 19-22 |
6 |
33 |
39 |
22 |
* |
|
2005 Dec 5-8 |
6 |
31 |
43 |
20 |
* |
|
2005 Nov 17-20 |
5 |
32 |
39 |
24 |
* |
|
2005 Nov 7-10 |
3 |
29 |
47 |
21 |
* |
|
2005 Oct 24-26 |
3 |
26 |
45 |
25 |
1 |
|
2005 Oct 13-16 |
3 |
25 |
46 |
26 |
* |
|
2005 Sep 26-28 |
3 |
28 |
41 |
27 |
1 |
|
2005 Sep 12-15 |
3 |
28 |
44 |
25 |
* |
|
2005 Aug 22-25 |
4 |
30 |
42 |
24 |
* |
|
2005 Aug 8-11 |
4 |
32 |
46 |
18 |
* |
|
2005 Jul 25-28 |
4 |
28 |
44 |
23 |
1 |
|
2005 Jul 7-10 |
3 |
33 |
45 |
18 |
1 |
|
2005 Jun 16-19 |
4 |
33 |
40 |
23 |
* |
|
2005 Jun 6-8 |
4 |
31 |
45 |
20 |
* |
|
2005 May 23-26 |
3 |
37 |
41 |
19 |
* |
|
2005 May 2-5 |
1 |
30 |
44 |
25 |
* |
|
2005 Apr 18-21 |
2 |
29 |
44 |
24 |
1 |
|
2005 Apr 4-7 |
3 |
29 |
49 |
18 |
1 |
|
2005 Mar 21-23 |
2 |
30 |
43 |
24 |
1 |
|
2005 Mar 7-10 |
3 |
32 |
48 |
16 |
1 |
|
2005 Feb 21-24 |
5 |
33 |
42 |
20 |
* |
|
2005 Feb 7-10 |
3 |
37 |
44 |
16 |
* |
|
2005 Jan 3-5 |
3 |
38 |
42 |
17 |
* |
|
2004 |
|
Good |
Only
|
|
No
|
|
2004 Dec 5-8 |
2 |
35 |
43 |
19 |
1 |
|
2004 Nov 7-10 |
3 |
33 |
44 |
20 |
* |
|
2004 Oct 11-14 |
2 |
32 |
44 |
22 |
* |
|
2004 Oct 9-10 |
4 |
31 |
40 |
24 |
1 |
|
2004 Sep 13-15 |
3 |
36 |
39 |
22 |
* |
|
2004 Aug 9-11 |
3 |
36 |
40 |
21 |
* |
|
2004 Jul 30-Aug 1 |
6 |
32 |
39 |
23 |
* |
|
2004 Jul 8-11 |
5 |
32 |
41 |
21 |
1 |
|
2004 Jun 3-6 |
3 |
32 |
44 |
21 |
* |
|
2004 May 2-4 |
2 |
27 |
43 |
27 |
1 |
|
2004 Apr 5-8 |
3 |
31 |
44 |
22 |
* |
|
2004 Mar 8-11 |
2 |
30 |
44 |
24 |
* |
|
2004 Feb 9-12 |
2 |
31 |
46 |
21 |
-- |
|
2004 Jan 12-15 |
3 |
34 |
42 |
21 |
-- |
|
2004 Jan 2-5 |
3 |
40 |
41 |
16 |
* |
|
2003 |
% |
% |
% |
% |
% |
|
2003 Dec 11-14 |
3 |
34 |
44 |
19 |
* |
|
2003 Nov 3-5 |
2 |
28 |
49 |
21 |
* |
|
2003 Oct 24-26 |
2 |
24 |
44 |
30 |
* |
|
2003 Oct 6-8 |
2 |
20 |
50 |
27 |
1 |
|
2003 Sep 8-10 |
1 |
20 |
49 |
30 |
* |
|
2003 Aug 4-6 |
1 |
24 |
52 |
23 |
* |
|
2003 Jul 7-9 |
1 |
23 |
50 |
26 |
* |
|
2003 Jun 12-15 |
1 |
25 |
49 |
25 |
* |
|
2003 May 19-21 |
1 |
20 |
47 |
31 |
1 |
|
2003 May 5-7 |
1 |
21 |
50 |
28 |
* |
|
2003 Apr 7-9 |
2 |
25 |
51 |
22 |
* |
|
2003 Mar 29-30 |
1 |
25 |
51 |
23 |
* |
|
2003 Mar 24-25 |
3 |
30 |
47 |
20 |
-- |
|
2003 Mar 3-5 |
1 |
21 |
46 |
32 |
* |
|
2003 Feb 17-19 |
1 |
17 |
48 |
34 |
* |
|
2003 Feb 3-6 |
2 |
20 |
53 |
25 |
* |
|
2003 Jan 20-22 |
1 |
19 |
49 |
31 |
* |
|
2003 Jan 13-16 |
2 |
20 |
50 |
28 |
* |
|
2002 |
|
|
|
|
|
|
2002 Dec 19-22 |
1 |
23 |
48 |
28 |
* |
|
2002 Dec 5-8 |
2 |
23 |
51 |
24 |
* |
|
2002 Nov 22-24 |
2 |
30 |
45 |
23 |
* |
|
2002 Oct 31-Nov 3 |
2 |
26 |
45 |
26 |
1 |
|
2002 Oct 3-6 |
2 |
24 |
46 |
27 |
1 |
|
2002 Sep 23-26 |
2 |
25 |
47 |
25 |
1 |
|
2002 Sep 5-8 |
2 |
22 |
53 |
23 |
* |
|
2002 Aug 19-21 |
1 |
23 |
47 |
28 |
1 |
|
2002 Aug 5-8 |
1 |
27 |
52 |
19 |
1 |
|
2002 Jul 29-31 |
2 |
27 |
48 |
22 |
1 |
|
2002 Jul 22-24 |
2 |
25 |
48 |
24 |
1 |
|
2002 Jul 9-11 |
2 |
26 |
51 |
20 |
1 |
|
2002 Jun 17-19 |
2 |
35 |
43 |
19 |
1 |
|
2002 Jun 3-6 |
3 |
33 |
49 |
14 |
1 |
|
2002 May 20-22 |
3 |
38 |
46 |
12 |
1 |
|
2002 May 6-9 |
2 |
33 |
51 |
14 |
* |
|
2002 Apr 22-24 |
2 |
37 |
46 |
14 |
1 |
|
2002 Apr 8-11 |
2 |
36 |
51 |
11 |
* |
|
2002 Mar 4-7 |
3 |
31 |
51 |
14 |
1 |
|
2002 Feb 4-6 |
2 |
26 |
55 |
16 |
1 |
|
2002 Jan 7-9 |
2 |
27 |
54 |
16 |
1 |
|
* Less than 0.5% |
|||||
Q.5 (CURRENT ECONOMIC CONDITIONS) CONTINUED
|
|
|
|
Only
|
|
No
|
|
2001 |
% |
% |
% |
% |
% |
|
2001 Dec 6-9 |
2 |
29 |
53 |
16 |
* |
|
2001 Nov 8-11 |
2 |
29 |
50 |
19 |
* |
|
2001 Oct 11-14 |
2 |
36 |
48 |
13 |
1 |
|
2001 Sep 14-15 |
3 |
43 |
44 |
9 |
1 |
|
2001 Sep 7-10 |
2 |
30 |
49 |
19 |
* |
|
2001 Aug 16-19 |
2 |
34 |
49 |
14 |
1 |
|
2001 Jul 19-22 |
3 |
38 |
47 |
11 |
1 |
|
2001 Jun 11-17 |
3 |
39 |
45 |
12 |
1 |
|
2001 May 10-14 |
3 |
37 |
45 |
15 |
* |
|
2001 Apr 6-8 |
4 |
41 |
41 |
14 |
* |
|
2001 Mar 5-7 |
3 |
43 |
43 |
10 |
1 |
|
2001 Feb 1-4 |
7 |
44 |
36 |
13 |
* |
|
2001 Jan 10-14 |
11 |
56 |
27 |
6 |
* |
|
2000 |
|
|
|
|
|
|
2000 Dec 2-4 |
12 |
51 |
28 |
8 |
1 |
|
2000 Nov 13-15 |
19 |
53 |
21 |
7 |
* |
|
2000 Oct 6-9 |
14 |
57 |
24 |
4 |
1 |
|
2000 Aug 18-19 |
25 |
49 |
21 |
4 |
1 |
|
2000 Jul 25-26 |
26 |
48 |
21 |
4 |
1 |
|
2000 May 18-21 |
17 |
49 |
24 |
9 |
1 |
|
2000 Apr 3-9 |
14 |
46 |
30 |
9 |
1 |
|
2000 Jan 7-10 |
19 |
52 |
23 |
5 |
1 |
|
1999 |
% |
% |
% |
% |
% |
|
1999 Oct 21-24 |
16 |
49 |
27 |
8 |
* |
|
1999 Sep 10-14 |
20 |
47 |
24 |
8 |
1 |
|
1999 Aug 24-26 |
14 |
50 |
28 |
7 |
1 |
|
1999 Jun 4-5 |
18 |
56 |
21 |
5 |
* |
|
1999 Jan 15-17 |
14 |
55 |
27 |
4 |
* |
|
1998 |
|
|
|
|
|
|
1998 Dec 4-6 |
13 |
52 |
27 |
8 |
* |
|
1998 Oct 29-Nov 1 |
13 |
53 |
27 |
6 |
1 |
|
1998 Sep 1 |
11 |
54 |
25 |
9 |
1 |
|
1998 Mar 20-22 |
20 |
46 |
27 |
7 |
* |
|
1997 |
|
|
|
|
|
|
1997 Dec 18-21 |
7 |
41 |
38 |
12 |
2 |
|
1997 Nov 6-9 |
10 |
48 |
33 |
9 |
* |
|
1997 Aug 22-25^ |
8 |
41 |
38 |
13 |
* |
|
1997 May 6-7 |
7 |
39 |
38 |
15 |
1 |
|
1997 Jan 31-Feb 2 |
4 |
38 |
43 |
15 |
* |
|
|
|
Only
|
|
No
|
|
|
1996 |
% |
% |
% |
% |
% |
|
1996 Oct 26-29 |
5 |
42 |
39 |
13 |
1 |
|
1996 Aug 30-Sep 1 † |
3 |
34 |
46 |
16 |
1 |
|
1996 Jul 18-21 |
5 |
38 |
43 |
14 |
* |
|
1996 May 9-12 |
3 |
27 |
50 |
19 |
1 |
|
1996 Apr 9-10 |
1 |
26 |
52 |
20 |
1 |
|
1996 Mar 15-17 |
2 |
31 |
48 |
18 |
1 |
|
1996 Jan 5-7 |
1 |
28 |
47 |
23 |
1 |
|
1995 |
|
|
|
|
|
|
1995 Nov 6-8 |
2 |
28 |
47 |
22 |
1 |
|
1995 May 11-14 |
2 |
27 |
50 |
20 |
1 |
|
1994 |
|
|
|
|
|
|
1994 Dec 16-18 |
2 |
25 |
52 |
21 |
* |
|
1994 Nov 2-6 |
2 |
28 |
49 |
20 |
1 |
|
1994 Oct 22-25 |
1 |
25 |
52 |
21 |
1 |
|
1994 Jul 15-17 |
1 |
26 |
52 |
21 |
* |
|
1994 Apr 22-24 |
1 |
23 |
49 |
26 |
1 |
|
1994 Jan 15-17 |
* |
22 |
54 |
24 |
* |
|
1993 |
|
|
|
|
|
|
1993 Dec 4-6 |
1 |
20 |
57 |
21 |
1 |
|
1993 Nov 2-4 |
1 |
16 |
50 |
33 |
* |
|
1993 Aug 8-10 |
* |
10 |
49 |
40 |
1 |
|
1993 Jun 29-30 |
1 |
14 |
52 |
32 |
1 |
|
1993 Feb 12-14 |
* |
14 |
46 |
39 |
1 |
|
1992 |
|
|
|
|
|
|
1992 Dec 18-20 |
2 |
16 |
34 |
47 |
1 |
|
1992 Dec 4-6 |
1 |
14 |
41 |
43 |
1 |
|
1992 Oct 23-25 |
* |
11 |
45 |
43 |
1 |
|
1992 Sep 11-15 |
1 |
10 |
37 |
51 |
1 |
|
1992 Aug 31-Sep 2 † |
1 |
9 |
37 |
53 |
* |
|
1992 Jun 12-14 † |
1 |
11 |
47 |
41 |
* |
|
1992 Apr 9-12 † |
1 |
11 |
40 |
48 |
* |
|
1992 Jan 3-6 |
* |
12 |
46 |
41 |
1 |
|
* Less than 0.5% |
|||||
6. Right now, do you think that economic conditions in the country as a whole are getting better or getting worse?
|
|
Getting
|
Getting
|
SAME
|
No
|
|
2007 |
% |
% |
% |
% |
|
2007 Aug 13-16 |
20 |
72 |
6 |
2 |
|
|
|
|
|
|
|
2007 Jul 12-15 |
29 |
59 |
10 |
3 |
|
2007 Jul 6-8 |
30 |
61 |
7 |
3 |
|
2007 Jun 11-14 |
23 |
70 |
6 |
2 |
|
2007 May 10-13 |
28 |
67 |
5 |
1 |
|
2007 Apr 2-5 |
29 |
60 |
9 |
2 |
|
2007 Mar 11-14 |
28 |
62 |
7 |
3 |
|
2007 Feb 1-4 |
38 |
52 |
7 |
2 |
|
2007 Jan 15-18 |
38 |
53 |
6 |
3 |
|
2006 |
|
|
|
|
|
2006 Dec 11-14 |
35 |
54 |
8 |
2 |
|
2006 Nov 9-12 |
38 |
50 |
8 |
4 |
|
2006 Oct 20-22 |
41 |
54 |
4 |
2 |
|
2006 Oct 9-12 |
38 |
52 |
7 |
3 |
|
2006 Sep 7-10 |
31 |
61 |
6 |
2 |
|
2006 Aug 7-10 |
22 |
68 |
8 |
2 |
|
2006 Jul 6-9 |
28 |
64 |
7 |
2 |
|
2006 Jun 1-4 |
28 |
61 |
9 |
3 |
|
2006 May 8-11 |
26 |
68 |
4 |
2 |
|
2006 Apr 10-13 |
29 |
64 |
5 |
2 |
|
2006 Mar 13-16 |
29 |
61 |
8 |
2 |
|
2006 Feb 6-9 |
34 |
57 |
7 |
3 |
|
2006 Jan 20-22 |
35 |
54 |
7 |
3 |
|
2006 Jan 9-12 |
39 |
52 |
7 |
2 |
|
2005 |
% |
% |
% |
% |
|
2005 Dec 19-22 |
37 |
56 |
5 |
2 |
|
2005 Dec 5-8 |
39 |
50 |
8 |
3 |
|
2005 Nov 17-20 |
36 |
58 |
5 |
1 |
|
2005 Nov 7-10 |
30 |
61 |
7 |
2 |
|
2005 Oct 24-26 |
25 |
66 |
7 |
2 |
|
2005 Oct 13-16 |
24 |
68 |
6 |
2 |
|
2005 Sep 26-28 |
24 |
66 |
7 |
3 |
|
2005 Sep 12-15 |
25 |
66 |
7 |
2 |
|
2005 Aug 22-25 |
28 |
63 |
7 |
2 |
|
2005 Aug 8-11 |
36 |
52 |
9 |
3 |
|
2005 Jul 25-28 |
35 |
53 |
9 |
3 |
|
2005 Jul 7-10 |
35 |
54 |
8 |
3 |
|
2005 Jun 16-19 |
35 |
57 |
6 |
2 |
|
2005 Jun 6-8 |
35 |
55 |
8 |
2 |
|
2005 May 23-26 |
41 |
52 |
5 |
2 |
|
2005 May 2-5 |
32 |
61 |
6 |
1 |
|
2005 Apr 18-21 |
31 |
61 |
5 |
3 |
|
2005 Apr 4-7 |
35 |
56 |
6 |
3 |
|
2005 Mar 21-23 |
33 |
59 |
6 |
2 |
|
2005 Mar 7-10 |
41 |
50 |
6 |
3 |
|
2005 Feb 21-24 |
43 |
48 |
7 |
2 |
|
2005 Feb 7-10 |
47 |
44 |
7 |
2 |
|
2005 Jan 3-5 |
48 |
42 |
7 |
3 |
|
Getting
|
Getting
|
SAME
|
No
|
|
|
2004 |
% |
% |
% |
% |
|
2004 Dec 5-8 |
47 |
42 |
8 |
3 |
|
2004 Nov 7-10 |
49 |
43 |
6 |
2 |
|
2004 Oct 11-14 |
39 |
50 |
8 |
3 |
|
2004 Oct 9-10 |
43 |
48 |
7 |
2 |
|
2004 Sep 13-15 |
47 |
45 |
6 |
2 |
|
2004 Aug 9-11 |
45 |
46 |
7 |
2 |
|
2004 Jul 30-Aug 1 |
48 |
43 |
7 |
2 |
|
2004 Jul 8-11 |
51 |
38 |
7 |
4 |
|
2004 Jun 3-6 |
47 |
45 |
6 |
2 |
|
2004 May 2-4 |
43 |
51 |
4 |
2 |
|
2004 Apr 5-8 |
47 |
45 |
6 |
2 |
|
2004 Mar 8-11 |
44 |
47 |
7 |
2 |
|
2004 Feb 9-12 |
53 |
40 |
6 |
1 |
|
2004 Jan 12-15 |
53 |
39 |
6 |
2 |
|
2004 Jan 2-5 |
66 |
27 |
4 |
3 |
|
2003 |
|
|
|
|
|
2003 Dec 11-14 |
60 |
32 |
7 |
1 |
|
2003 Nov 3-5 |
53 |
37 |
8 |
2 |
|
2003 Oct 24-26 |
47 |
43 |
8 |
2 |
|
2003 Oct 6-8 |
45 |
46 |
7 |
2 |
|
2003 Sep 8-10 |
40 |
50 |
8 |
2 |
|
2003 Aug 4-6 |
44 |
45 |
9 |
2 |
|
2003 Jul 7-9 |
43 |
47 |
8 |
2 |
|
2003 Jun 12-15 |
45 |
43 |
10 |
2 |
|
2003 May 19-21 |
40 |
48 |
10 |
2 |
|
2003 May 5-7 |
42 |
51 |
5 |
2 |
|
2003 Apr 7-9 |
36 |
51 |
11 |
2 |
|
2003 Mar 29-30 |
33 |
56 |
9 |
2 |
|
2003 Mar 24-25 |
39 |
47 |
11 |
3 |
|
2003 Mar 3-5 |
23 |
67 |
7 |
3 |
|
2003 Feb 17-19 |
26 |
63 |
9 |
2 |
|
2003 Feb 3-6 |
27 |
60 |
11 |
2 |
|
2003 Jan 20-22 |
29 |
57 |
12 |
2 |
|
2003 Jan 13-16 |
34 |
54 |
10 |
2 |
|
2002 |
|
|
|
|
|
2002 Dec 19-22 |
35 |
50 |
12 |
3 |
|
2002 Dec 5-8 |
35 |
54 |
8 |
3 |
|
2002 Nov 22-24 |
38 |
53 |
8 |
1 |
|
2002 Oct 31-Nov 3 |
37 |
51 |
8 |
4 |
|
2002 Oct 3-6 |
30 |
59 |
8 |
3 |
|
2002 Sep 23-26 |
33 |
52 |
10 |
5 |
|
2002 Sep 5-8 |
35 |
54 |
9 |
2 |
|
2002 Aug 19-21 |
38 |
48 |
10 |
4 |
|
2002 Aug 5-8 |
32 |
55 |
9 |
4 |
|
2002 Jul 29-31 |
42 |
47 |
8 |
3 |
|
2002 Jul 22-24 |
27 |
59 |
10 |
4 |
|
2002 Jul 9-11 |
31 |
57 |
10 |
2 |
|
2002 Jun 17-19 |
47 |
40 |
10 |
3 |
|
2002 Jun 3-6 |
48 |
38 |
11 |
3 |
|
2002 May 20-22 |
49 |
34 |
14 |
3 |
|
2002 May 6-9 |
52 |
39 |
7 |
2 |
|
2002 Apr 22-24 |
53 |
35 |
10 |
2 |
|
2002 Apr 8-11 |
53 |
37 |
7 |
3 |
|
2002 Mar 4-7 |
54 |
37 |
7 |
2 |
|
2002 Feb 4-6 |
41 |
47 |
10 |
2 |
|
2002 Jan 7-9 |
49 |
41 |
8 |
2 |
|
(vol.) = Volunteered response |
||||
Q.6 (ECONOMIC OUTLOOK) CONTINUED
|
|
Getting
|
Getting
|
SAME
|
No
|
|
2001 |
% |
% |
% |
% |
|
2001 Dec 6-9 |
44 |
48 |
6 |
2 |
|
2001 Nov 8-11 |
30 |
59 |
7 |
4 |
|
2001 Oct 11-14 |
33 |
55 |
10 |
2 |
|
2001 Sep 14-15 |
28 |
60 |
8 |
4 |
|
2001 Sep 7-10 |
19 |
70 |
9 |
2 |
|
2001 Aug 16-19 |
27 |
59 |
11 |
3 |
|
2001 Jul 19-22 |
35 |
53 |
9 |
3 |
|
2001 Jun 11-17 |
29 |
60 |
8 |
3 |
|
2001 May 10-14 |
25 |
63 |
9 |
3 |
|
2001 Apr 6-8 |
24 |
63 |
9 |
4 |
|
2001 Mar 5-7 |
28 |
61 |
7 |
4 |
|
2001 Feb 1-4 |
23 |
66 |
8 |
3 |
|
2001 Jan 10-14 |
32 |
56 |
8 |
4 |
|
2000 |
|
|
|
|
|
2000 Dec 2-4 |
39 |
48 |
8 |
5 |
|
2000 Nov 13-15 |
50 |
38 |
9 |
3 |
|
2000 Oct 6-9 |
54 |
34 |
10 |
2 |
|
2000 Aug 18-19 |
60 |
26 |
10 |
4 |
|
2000 Jul 25-26 |
58 |
29 |
9 |
4 |
|
2000 May 18-21 |
52 |
37 |
9 |
2 |
|
2000 Jan 7-10 |
69 |
23 |
6 |
2 |
|
1999 |
|
|
|
|
|
1999 Oct 21-24 |
52 |
34 |
11 |
3 |
|
1999 Sep 10-14 |
59 |
29 |
9 |
3 |
|
1999 Aug 24-26 |
54 |
31 |
12 |
3 |
|
1999 Jun 4-5 |
60 |
27 |
9 |
4 |
|
1999 Jan 15-17 |
63 |
28 |
6 |
3 |
|
Getting
|
Getting
|
SAME
|
No
|
|
|
1998 |
% |
% |
% |
% |
|
1998 Dec 4-6 |
52 |
38 |
8 |
2 |
|
1998 Oct 29-Nov 1 |
51 |
38 |
8 |
3 |
|
1998 Sep 1 |
45 |
41 |
11 |
3 |
|
1997 |
|
|
|
|
|
1997 Dec 18-21 |
49 |
39 |
8 |
4 |
|
1997 Nov 6-9 |
51 |
37 |
9 |
3 |
|
1997 May 6-7 |
50 |
40 |
7 |
3 |
|
1997 Jan 31-Feb 2 |
46 |
39 |
12 |
3 |
|
1996 |
|
|
|
|
|
1996 Oct 26-29 |
50 |
38 |
7 |
5 |
|
1996 Aug 30-Sep 1 ^ |
52 |
37 |
8 |
3 |
|
1996 Jul 18-21 |
43 |
46 |
9 |
2 |
|
1996 May 9-12 |
39 |
49 |
9 |
3 |
|
1992 |
% |
% |
% |
% |
|
1992 Aug 31-Sep 2 ^ |
29 |
59 |
10 |
2 |
|
1992 Aug 10-12 ^ |
24 |
65 |
10 |
1 |
|
1992 Jun 12-14 ^ |
28 |
61 |
9 |
2 |
|
1992 Apr 9-12 ^ |
40 |
45 |
13 |
2 |
|
1992 Mar 20-22 ^ |
37 |
51 |
11 |
1 |
|
1992 Jan 31-Feb 1 ^ |
22 |
70 |
7 |
1 |
|
1992 Jan 3-6 |
22 |
71 |
6 |
1 |
|
1991 |
|
|
|
|
|
1991 Dec 5-8 |
19 |
69 |
9 |
3 |
|
1991 Sep 5-8 |
27 |
60 |
10 |
3 |
|
1991 Jul 11-14 |
34 |
51 |
9 |
6 |
|
(vol.) = Volunteered response |
||||
Q.5-6 CONTINUED
ECONOMIC OUTLOOK GROUPS (COMBINED RESPONSES: Q.5-6)
|
Positive |
|
Negative |
Undesignated |
|
|
2007 |
% |
% |
% |
% |
|
2007 Aug 13-16 |
17 |
22 |
59 |
2 |
|
|
|
|
|
|
|
2007 Jul 12-15 |
25 |
22 |
49 |
3 |
|
2007 Jul 6-8 |
25 |
18 |
54 |
3 |
|
2007 Jun 11-14 |
20 |
19 |
60 |
2 |
|
2007 May 10-13 |
21 |
20 |
58 |
1 |
|
2007 Apr 2-5 |
28 |
20 |
50 |
2 |
|
2007 Mar 11-14 |
23 |
22 |
52 |
3 |
|
2007 Feb 1-4 |
31 |
21 |
45 |
3 |
|
2007 Jan 15-18 |
34 |
25 |
38 |
3 |
|
2006 |
|
|
|
|
|
2006 Dec 11-14 |
29 |
23 |
45 |
3 |
|
2006 Nov 9-12 |
30 |
20 |
45 |
4 |
|
2006 Oct 20-22 |
32 |
20 |
45 |
2 |
|
2006 Oct 9-12 |
31 |
19 |
47 |
3 |
|
2006 Sep 7-10 |
24 |
19 |
54 |
3 |
|
2006 Aug 7-10 |
20 |
20 |
58 |
2 |
|
2006 Jul 6-9 |
22 |
23 |
52 |
3 |
|
2006 Jun 1-4 |
24 |
18 |
55 |
3 |
|
2006 May 8-11 |
19 |
18 |
61 |
2 |
|
2006 Apr 10-13 |
25 |
19 |
55 |
2 |
|
2006 Mar 13-16 |
24 |
18 |
55 |
2 |
|
2006 Feb 6-9 |
26 |
22 |
50 |
3 |
|
2006 Jan 20-22 |
30 |
17 |
49 |
4 |
|
2006 Jan 9-12 |
31 |
22 |
44 |
2 |
|
2005 |
|
|
|
|
|
2005 Dec 19-22 |
28 |
20 |
50 |
2 |
|
2005 Dec 5-8 |
28 |
22 |
47 |
3 |
|
2005 Nov 17-20 |
25 |
23 |
50 |
2 |
|
2005 Nov 7-10 |
22 |
21 |
55 |
2 |
|
2005 Oct 24-26 |
21 |
16 |
61 |
2 |
|
2005 Oct 13-16 |
18 |
18 |
62 |
2 |
|
2005 Sep 26-28 |
20 |
15 |
61 |
4 |
|
2005 Sep 12-15 |
21 |
17 |
60 |
2 |
|
2005 Aug 22-25 |
23 |
20 |
55 |
2 |
|
2005 Aug 8-11 |
25 |
22 |
50 |
3 |
|
2005 Jul 25-28 |
25 |
19 |
53 |
3 |
|
2005 Jul 7-10 |
25 |
23 |
49 |
3 |
|
2005 Jun 16-19 |
27 |
18 |
52 |
3 |
|
2005 Jun 6-8 |
25 |
22 |
51 |
2 |
|
2005 May 23-26 |
31 |
21 |
46 |
2 |
|
2005 May 2-5 |
21 |
22 |
55 |
2 |
|
2005 Apr 18-21 |
22 |
20 |
55 |
3 |
|
2005 Apr 4-7 |
23 |
22 |
52 |
3 |
|
2005 Mar 21-23 |
25 |
18 |
54 |
3 |
|
2005 Mar 7-10 |
27 |
24 |
46 |
3 |
|
2005 Feb 21-24 |
31 |
21 |
45 |
3 |
|
2005 Feb 7-10 |
34 |
20 |
44 |
2 |
|
2005 Jan 3-5 |
34 |
23 |
40 |
3 |
|
Positive |
Mixed |
Negative |
Undesignated |
|
|
2004 |
% |
% |
% |
% |
|
2004 Dec 5-8 |
32 |
22 |
42 |
4 |
|
2004 Nov 7-10 |
30 |
25 |
43 |
2 |
|
2004 Oct 11-14 |
27 |
21 |
49 |
3 |
|
2004 |
|
|
|
|
|
2004 Oct 9-10 |
30 |
19 |
48 |
3 |
|
2004 Sep 13-15 |
32 |
23 |
43 |
2 |
|
2004 Aug 9-11 |
32 |
22 |
44 |
2 |
|
2004 Jul 30-Aug 1 |
33 |
21 |
43 |
3 |
|
2004 Jul 8-11 |
31 |
26 |
39 |
4 |
|
2004 Jun 3-6 |
27 |
30 |
41 |
2 |
|
2004 May 2-4 |
25 |
23 |
50 |
2 |
|
2004 Apr 5-8 |
28 |
26 |
44 |
2 |
|
2004 Mar 8-11 |
26 |
26 |
46 |
2 |
|
2004 Feb 9-12 |
28 |
31 |
40 |
1 |
|
2004 Jan 12-15 |
30 |
31 |
38 |
1 |
|
2004 Jan 2-5 |
38 |
33 |
26 |
3 |
|
2003 |
|
|
|
|
|
2003 Dec 11-14 |
33 |
33 |
33 |
1 |
|
2003 Nov 3-5 |
25 |
34 |
39 |
2 |
|
2003 Oct 24-26 |
22 |
30 |
46 |
2 |
|
2003 Oct 6-8 |
18 |
32 |
48 |
2 |
|
2003 Sep 8-10 |
17 |
29 |
52 |
2 |
|
2003 Aug 4-6 |
19 |
32 |
47 |
2 |
|
2003 Jul 7-9 |
19 |
31 |
48 |
2 |
|
2003 Jun 12-15 |
21 |
31 |
46 |
2 |
|
2003 May 19-21 |
15 |
32 |
50 |
3 |
|
2003 May 5-7 |
16 |
34 |
48 |
2 |
|
2003 Apr 7-9 |
20 |
27 |
51 |
2 |
|
2003 Mar 29-30 |
18 |
26 |
54 |
2 |
|
2003 Mar 24-25 |
24 |
28 |
45 |
3 |
|
2003 Mar 3-5 |
12 |
20 |
64 |
4 |
|
2003 Feb 17-19 |
11 |
24 |
63 |
2 |
|
2003 Feb 3-6 |
12 |
27 |
59 |
2 |
|
2003 Jan 20-22 |
13 |
26 |
59 |
2 |
|
2003 Jan 13-16 |
14 |
29 |
54 |
3 |
|
2002 |
% |
% |
% |
% |
|
2002 Dec 19-22 |
17 |
26 |
54 |
3 |
|
2002 Dec 5-8 |
17 |
27 |
53 |
3 |
|
2002 Nov 22-24 |
22 |
29 |
48 |
1 |
|
2002 Oct 31-Nov 3 |
20 |
27 |
49 |
4 |
|
2002 Oct 3-6 |
16 |
25 |
55 |
4 |
|
2002 Sep 23-26 |
20 |
21 |
53 |
6 |
|
2002 Sep 5-8 |
16 |
29 |
53 |
2 |
|
2002 Aug 19-21 |
19 |
26 |
51 |
4 |
|
2002 Aug 5-8 |
16 |
30 |
50 |
4 |
|
2002 Jul 29-31 |
22 |
30 |
45 |
3 |
|
2002 Jul 22-24 |
16 |
24 |
55 |
5 |
|
2002 Jul 9-11 |
16 |
29 |
52 |
3 |
|
2002 Jun 17-19 |
30 |
27 |
40 |
3 |
|
2002 Jun 3-6 |
29 |
29 |
39 |
3 |
|
2002 May 20-22 |
33 |
28 |
36 |
3 |
|
2002 May 6-9 |
28 |
32 |
37 |
3 |
|
2002 Apr 22-24 |
32 |
31 |
34 |
3 |
|
2002 Apr 8-11 |
30 |
32 |
35 |
3 |
|
2002 Mar 4-7 |
26 |
36 |
35 |
3 |
|
2002 Feb 4-6 |
19 |
31 |
47 |
3 |
|
2002 Jan 7-9 |
21 |
37 |
40 |
2 |
Q.5-6 CONTINUED
ECONOMIC OUTLOOK GROUPS CONTINUED (COMBINED RESPONSES: Q.5-6)
|
|
|
|
|
Undesignated |
|
2001 |
% |
% |
% |
% |
|
2001 Dec 6-9 |
20 |
35 |
42 |
3 |
|
2001 Nov 8-11 |
17 |
29 |
50 |
4 |
|
2001 Oct 11-14 |
21 |
33 |
43 |
3 |
|
2001 Sep 14-15 |
23 |
29 |
43 |
5 |
|
2001 Sep 7-10 |
15 |
24 |
59 |
2 |
|
2001 Aug 16-19 |
20 |
27 |
50 |
3 |
|
2001 Jul 19-22 |
25 |
29 |
42 |
4 |
|
2001 Jun 11-17 |
22 |
28 |
45 |
5 |
|
2001 May 10-14 |
20 |
28 |
49 |
3 |
|
2001 Apr 6-8 |
21 |
30 |
44 |
5 |
|
2001 Mar 5-7 |
22 |
33 |
41 |
4 |
|
2001 Feb 1-4 |
22 |
33 |
42 |
3 |
|
2000 |
|
|
|
|
|
2001 Jan 10-14 |
30 |
40 |
26 |
4 |
|
2000 Dec 2-4 |
36 |
35 |
25 |
4 |
|
2000 Nov 13-15 |
47 |
32 |
18 |
3 |
|
2000 Oct 6-9 |
51 |
28 |
18 |
3 |
|
2000 Jul 25-26 |
57 |
23 |
16 |
4 |
|
2000 May 18-21 |
48 |
28 |
21 |
3 |
|
2000 Jan 7-10 |
61 |
21 |
15 |
3 |
|
1999 |
|
|
|
|
|
1999 Oct 21-24 |
50 |
24 |
23 |
3 |
|
1999 Sep 10-14 |
55 |
22 |
19 |
4 |
|
1999 Aug 24-26 |
48 |
28 |
21 |
3 |
|
1999 Jun 4-5 |
59 |
20 |
17 |
4 |
|
1999 Jan 15-17 |
54 |
26 |
17 |
3 |
|
Positive |
|
Negative |
Undesignated |
|
|
1998 |
% |
% |
% |
% |
|
1998 Dec 4-6 |
47 |
28 |
23 |
2 |
|
1998 Oct 29-Nov 1 |
47 |
27 |
22 |
4 |
|
1998 Sep 1 |
45 |
27 |
24 |
4 |
|
1998 Mar 20-22 |
59 |
21 |
18 |
2 |
|
1997 |
|
|
|
|
|
1997 Dec 18-21 |
36 |
28 |
31 |
5 |
|
1997 Nov 6-9 |
46 |
23 |
28 |
3 |
|
1997 May 6-7 |
38 |
23 |
36 |
3 |
|
1997 Jan 31-Feb 2 |
33 |
24 |
40 |
3 |
|
1996 |
|
|
|
|
|
1996 Oct 26-29 |
37 |
25 |
33 |
5 |
|
1996 Aug 30-Sep 1 |
31 |
29 |
36 |
4 |
|
1996 July 18-21 |
32 |
25 |
40 |
3 |
|
1996 May 9-12 |
22 |
28 |
47 |
3 |
|
1992 |
|
|
|
|
|
1992 Aug 31-Sep 2 ^ |
7 |
25 |
66 |
2 |
|
1992 Jun 12-14 ^ |
8 |
25 |
65 |
2 |
|
^ Based on registered voters |
||||
D15. Which of the following best describes your current situation -- employed full-time, employed part-time, retired, a homemaker, a student, unemployed but looking for work, or unemployed and not looking for work?
|
|
2007 Aug 13-16 |
|
% |
|
|
Employed full-time |
50 |
|
Employed part-time |
8 |
|
Retired |
23 |
|
Homemaker |
7 |
|
Student |
5 |
|
Unemployed but looking for work |
3 |
|
Unemployed and not looking for work |
1 |
|
Disabled (vol.) |
2 |
|
|
|
|
No opinion |
1 |
|
|
|
|
(vol.) = Volunteered response |
|
7. Thinking about the job situation in America today, would you say that it is now a good time or a bad time to find a quality job?
|
|
National
|
Employed/
|
||||
|
|
Good time |
Bad time |
No opinion |
Good time |
Bad time |
No opinion |
|
% |
% |
% |
% |
% |
% |
|
|
2007 Aug 13-16 |
42 |
51 |
7 |
46 |
50 |
4 |
|
|
|
|
|
|
|
|
|
2007 Jul 12-15 |
43 |
50 |
7 |
46 |
49 |
5 |
|
2007 Jun 11-14 |
43 |
53 |
5 |
45 |
52 |
4 |
|
2007 May 10-13 |
47 |
50 |
3 |
49 |
48 |
2 |
|
2007 Apr 2-5 |
46 |
49 |
5 |
48 |
48 |
3 |
|
2007 Mar 11-14 |
45 |
49 |
6 |
47 |
50 |
3 |
|
2007 Feb 1-4 |
45 |
50 |
5 |
45 |
51 |
4 |
|
2007 Jan 15-18 |
48 |
47 |
5 |
48 |
48 |
4 |
|
2006 Dec 11-14 |
44 |
50 |
6 |
47 |
48 |
5 |
|
2006 Nov 9-12 |
41 |
53 |
5 |
44 |
53 |
3 |
|
2006 Oct 9-12 |
40 |
54 |
6 |
42 |
52 |
6 |
|
2006 Sep 7-10 |
41 |
54 |
5 |
44 |
53 |
3 |
|
2006 Aug 7-10 |
42 |
53 |
5 |
44 |
53 |
3 |
|
2006 Jul 6-9 |
42 |
51 |
7 |
45 |
50 |
5 |
|
2006 Jun 1-4 |
41 |
53 |
6 |
46 |
50 |
4 |
|
2006 May 8-11 |
42 |
52 |
6 |
46 |
49 |
5 |
|
2006 Apr 10-13 |
41 |
53 |
6 |
43 |
52 |
5 |
|
2006 Mar 13-16 |
41 |
55 |
5 |
43 |
54 |
3 |
|
2006 Feb 6-9 |
40 |
56 |
4 |
42 |
54 |
4 |
|
2006 Jan 9-12 |
41 |
55 |
4 |
41 |
56 |
3 |
|
2005 Dec 19-22 |
40 |
56 |
4 |
41 |
56 |
3 |
|
2005 Dec 5-8 |
36 |
60 |
4 |
37 |
59 |
4 |
|
2005 Nov 17-20 |
42 |
56 |
2 |
45 |
54 |
1 |
|
2005 Nov 7-10 |
37 |
59 |
4 |
40 |
58 |
2 |
|
2005 Oct 24-26 |
37 |
58 |
5 |
41 |
56 |
3 |
|
2005 Oct 13-16 |
35 |
62 |
3 |
35 |
62 |
3 |
|
2005 Sep 26-28 |
38 |
56 |
6 |
41 |
55 |
4 |
|
2005 Sep 12-15 |
38 |
59 |
3 |
42 |
56 |
2 |
|
2005 Aug 22-25 |
36 |
58 |
6 |
36 |
59 |
5 |
|
2005 Aug 8-11 |
39 |
58 |
3 |
42 |
56 |
2 |
|
2005 Jul 25-28 |
35 |
61 |
4 |
38 |
59 |
3 |
|
2005 Jul 7-10 |
39 |
58 |
3 |
41 |
57 |
2 |
|
2005 Jun 16-19 |
40 |
56 |
4 |
42 |
55 |
3 |
|
2005 Jun 6-8 |
35 |
62 |
3 |
38 |
59 |
3 |
|
2005 May 23-26 |
39 |
58 |
3 |
42 |
56 |
2 |
|
2005 May 2-5 |
38 |
59 |
3 |
39 |
59 |
2 |
|
2005 Apr 18-21 |
38 |
58 |
4 |
40 |
57 |
3 |
|
2005 Apr 4-7 |
37 |
59 |
4 |
39 |
57 |
4 |
|
2005 Mar 21-23 |
34 |
61 |
5 |
36 |
60 |
4 |
|
2005 Mar 7-10 |
39 |
57 |
4 |
41 |
57 |
2 |
|
2005 Feb 21-24 |
38 |
57 |
5 |
43 |
53 |
4 |
|
2005 Feb 7-10 |
38 |
59 |
3 |
37 |
61 |
2 |
|
2005 Jan 3-5 |
33 |
62 |
5 |
35 |
61 |
4 |
Q.7 (GOOD/BAD TIME TO FIND A QUALITY JOB) CONTINUED
|
|
National
|
Employed/
|
||||
|
|
Good time |
Bad time |
No opinion |
Good time |
Bad time |
No opinion |
|
% |
% |
% |
% |
% |
% |
|
|
2004 Dec 5-8 |
36 |
59 |
5 |
40 |
57 |
3 |
|
2004 Nov 7-10 |
37 |
60 |
3 |
38 |
60 |
2 |
|
2004 Oct 11-14 |
29 |
67 |
4 |
29 |
68 |
3 |
|
2004 Sep 13-15 |
34 |
61 |
5 |
37 |
60 |
3 |
|
2004 Aug 9-11 |
33 |
63 |
4 |
35 |
63 |
2 |
|
2004 Jul 8-11 |
36 |
61 |
3 |
37 |
61 |
2 |
|
2004 Jun 3-6 |
32 |
65 |
3 |
34 |
64 |
2 |
|
2004 May 2-4 |
30 |
67 |
3 |
30 |
67 |
3 |
|
2004 Apr 5-8 |
30 |
66 |
4 |
34 |
63 |
3 |
|
2004 Mar 8-11 |
28 |
69 |
3 |
30 |
68 |
2 |
|
2004 Feb 9-12 |
28 |
70 |
2 |
30 |
69 |
1 |
|
2004 Jan 12-15 |
31 |
68 |
1 |
34 |
65 |
1 |
|
2003 Dec 11-14 |
29 |
68 |
3 |
31 |
67 |
2 |
|
2003 Nov 3-5 |
24 |
73 |
3 |
25 |
73 |
2 |
|
2003 Oct 6-8 |
24 |
74 |
2 |
27 |
71 |
2 |
|
2003 Sep 8-10 |
19 |
79 |
2 |
20 |
78 |
2 |
|
2003 Aug 4-6 |
17 |
81 |
2 |
19 |
80 |
1 |
|
2003 Jul 7-9 |
20 |
78 |
2 |
23 |
76 |
1 |
|
2003 Jun 12-15 |
22 |
76 |
2 |
22 |
77 |
1 |
|
2003 May 5-7 |
22 |
75 |
3 |
24 |
74 |
2 |
|
2003 Apr 7-9 |
23 |
75 |
2 |
23 |
76 |
1 |
|
2003 Mar 3-5 |
16 |
81 |
3 |
16 |
82 |
2 |
|
2003 Feb 3-6 |
19 |
79 |
2 |
20 |
79 |
1 |
|
2003 Jan 13-16 |
20 |
78 |
2 |
20 |
78 |
2 |
|
2002 Dec 5-8 |
19 |
78 |
3 |
20 |
77 |
3 |
|
2002 Nov 11-14 |
27 |
69 |
4 |
29 |
68 |
3 |
|
2002 Oct 14-17 |
23 |
70 |
7 |
24 |
70 |
6 |
|
2002 Sep 5-8 |
22 |
74 |
4 |
23 |
75 |
2 |
|
2002 Aug 5-8 |
27 |
68 |
5 |
29 |
68 |
3 |
|
2002 Jul 9-11 |
26 |
69 |
5 |
28 |
68 |
4 |
|
2002 Jun 3-6 |
32 |
64 |
4 |
35 |
62 |
3 |
|
2002 May 6-9 |
29 |
67 |
4 |
30 |
67 |
3 |
|
2002 Apr 8-11 |
29 |
68 |
3 |
30 |
68 |
2 |
|
2002 Mar 4-7 |
26 |
72 |
2 |
28 |
70 |
2 |
|
2002 Feb 4-6 |
25 |
72 |
3 |
24 |
73 |
3 |
|
2002 Jan 7-9 |
24 |
73 |
3 |
24 |
73 |
3 |
|
2001 Dec 6-9 |
25 |
73 |
2 |
26 |
71 |
3 |
|
2001 Nov 8-11 |
22 |
75 |
3 |
22 |
75 |
3 |
|
2001 Oct 11-14 |
25 |
71 |
4 |
26 |
71 |
3 |
|
2001 Aug 16-19 |
39 |
56 |
5 |
38 |
59 |
3 |
|
2000 Aug 4-31 † |
-- |
-- |
-- |
78 |
16 |
6 |
|
2000 Jan 5-19 † |
-- |
-- |
-- |
76 |
19 |
5 |
|
1999 Feb 5-22 † |
-- |
-- |
-- |
70 |
24 |
6 |
|
1998 Aug 5-16 † |
-- |
-- |
-- |
69 |
25 |
6 |
|
^ Based on 571 employed adults or unemployed adults who are looking for work |
||||||
|
† Center for Survey Research & Analysis, Univ. of Connecticut & John J. Heldrich Center for Workforce Development at Rutgers University |
||||||