If the controversy over adequate and equitable state school funding was a fire, then some legal experts might view the No Child Left Behind Act as gasoline. And the 2003 PDK/Gallup poll* indicates that Americans would be somewhat divided on how to extinguish the flames.
States generally contribute about 50% of the funds for elementary and secondary school budgets; the "fire" starts when choices are made about how the state money is distributed to school districts. In the budget process, many state legislators are constitutionally bound to ensure enough money is allocated for each student to receive an education that meets their state's academic expectations. They also consider equitable distribution of state aid among poorer and richer districts. After these considerations, state legislatures distribute the funds to school districts on a per-pupil basis.
However, the definitions of "adequate" funds and "equitable distribution" are currently subjective enough to have landed a number of states in court, often pitting school districts against state lawmakers. Some districts argue that the funding formulas are flawed because they do not adequately provide for students with more costly education needs -- low-income or special needs students and minorities, for example. NCLB adds another wrinkle that could cause the adequacy of education funding in all states to be re-evaluated: School districts may argue that inadequate state funding leaves them open to federal penalties when students fall short of state achievement goals, and data collected for NCLB may provide the proof in court.
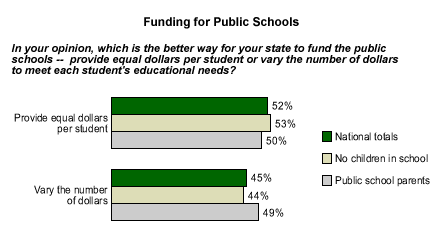
With the possibility that revisions in state funding formulas could end up on the ballot in several states next month, the results from the PDK/Gallup poll are particularly interesting. The poll asked Americans which is the better way for their states to fund the public schools -- by providing equal dollars per student, or by varying the number of dollars to meet each student's educational needs. A slim majority of Americans, 52%, say states should provide equal dollars, while a substantial percentage, 45%, say the dollars should be varied. Public school parents divide almost equally on this issue (50% favor equal funding per student, 49% favor varying dollars per student), while those without children in school show a slight preference for providing equal dollars per student (53% to 44% who favor variable funding).

Which option do low-income Americans and nonwhite Americans, two groups whose children have been identified as having more costly educational needs than average pupils, see as the better way to fund their public schools?
Perhaps surprisingly, opinions vary little by one's household income level. By a 52% to 47% margin, Americans living in households whose annual income exceeds $30,000 favor equal dollars over variable dollars. Americans in households with lower levels of income favor equal dollars per student by a similar margin, 51% to 43%.
The data suggest some differences by race. A majority of white Americans, 53%, favor equal dollars per student (44% of whites prefer varying dollars by individual students' needs). However, a majority of nonwhites (53%) prefer to vary the number of dollars, while 45% of nonwhites say funds should be distributed equally per student.
Bottom Line
Since 1980, at least 45 states have been embroiled in school finance suits. At least 18 states across the country are currently mired in litigation over their school funding formulas, and that number is likely to reach higher as states tighten their belts and NCLB mandates that school districts work harder. If states lose, as they tend to do in adequacy cases, taxpayers will likely feel the brunt in higher income taxes. Education policy-makers will be watching to see if the tide of public opinion changes at that point.
*The findings of the survey are based on telephone interviews with a random sample of 1,011 U.S. adults, aged 18 and older, conducted from May 28 to June 18, 2003. For results based on this sample, one can say with 95% confidence that the maximum error attributable to sampling and other random effects is ±3 percentage points.