INTRODUCTION
This document presents results of the annual Gallup Poll Social Series update on World Affairs, conducted Feb. 4-6, 2002. The findings of the current poll, along with historical comparisons to existing Gallup data, reveal the following:
- World affairs and terrorism have a more prominent place in Americans' minds than they did last year.
- Americans show overwhelming approval of George W. Bush as an international leader, to a much greater degree than they did last year.
- There has been little change in the way Americans view the United States' position in the world, although more Americans think the United States should play a leading role in solving international problems than did so prior to Sept. 11.
- Iraq and Iran are the nations Americans view least favorably. Americans' views of Saudi Arabia have shown the greatest decline following Sept. 11. Americans have also become more negative about Egypt. All three countries identified by President Bush as comprising the "Axis of Evil"-- Iraq, Iran and North Korea -- are viewed unfavorably by Americans.
- The five countries Americans view most favorably are Canada, Great Britain, Germany, Japan and France. Americans have become more positive toward Russia in the last year.
- Attitudes about national defense and defense spending are very similar to last year. Americans are actually less likely now than they were last year to say the United States is spending too little on defense, and more likely to say defense spending is about right.
- There has been an increase in support for the development of a missile defense system.
- Views about the Arab-Israeli conflict have changed very little over the last year, although a majority of Americans now believe that the development of a peaceful solution to that conflict is a very important U.S. foreign policy goal.
Contents
- Introduction
- Americans' Concern With World Affairs Increasing
- Impressions of Bush as a World Leader Have Improved Dramatically
- Views of the United States' Position in the World Have Changed Very Little
- Iraq, Iran Are Least Favorably Viewed Nations; Views of Saudi Arabia decline
- Development of Peace in Middle East Seen as More Important Goal to Americans
- Americans Remain Pessimistic That Peace Will Ever Develop between Arabs and Israelis
- Little Change in Americans' Evaluation of the Nation's Defense Capabilities
- Americans' Views on Foreign Aid Have Held Steady
- Evaluations of the United Nations Virtually Unchanged
- Detailed findings
Americans' Concern With World Affairs Increasing
The percentage of Americans who mention "terrorism," "war," or some other aspect of international affairs as the country's most important problem has increased dramatically since last year, from 9% to 44%.
| Percentage Mentioning Terrorism or International Issues as Most Important Problem |
 |
| Based on percentage mentioning "terrorism," "feeling of fear in the country or fear of war," "national security," "international issues or problems," or "lack of military defense." |
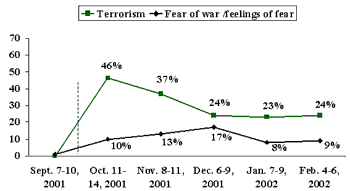
As might be expected, the percentage of Americans who cite "terrorism" or "war" as the most important problem facing the nation has declined in recent months, although this percentage now appears to be holding steady at roughly one-third, down from 56% in October.
| Most Important Problem: Percentage Mentioning Terrorism (Sept. 2001-Feb. 2002) |
 |
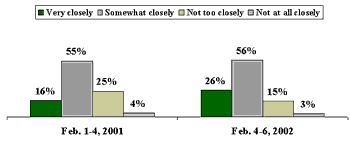
More Americans today say they are closely following news about foreign affairs than said this a year ago. The percentage who say they are following international news "very closely" has risen from 16% to 26%, although this increase is comparatively modest given the events of the past five months.
| In general, how closely do you follow news about foreign countries around the world, including relations between the United States and other countries -- very closely, somewhat closely, not too closely, or not at all? |
 |
Americans' Impressions of George W. Bush as a World Leader Have Improved Dramatically
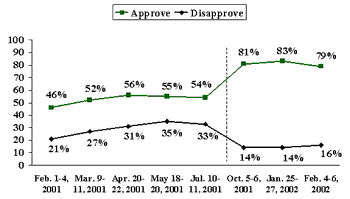
The percentage of Americans who approve of the way President Bush is handling foreign affairs spiked following the Sept. 11 terrorist attacks, and remains high, near 80%. These trends are strongly correlated to the pattern found for Bush's overall job approval rating.
| Bush Approval on Foreign Affairs |
 |
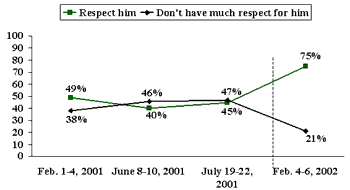
Americans are much more likely now than they were before Sept. 11 to believe that foreign leaders respect Bush. The level is 75% now, while it stood in the 40% range prior to Sept. 11.
| Respect for President Bush Around the World |
 |
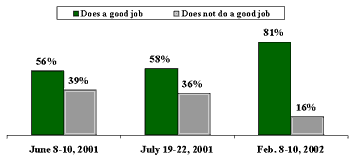
Eight in 10 Americans now think that Bush does a good job of representing America to the world, representing an increase of 25 percentage points from last June.
| Do you think George W. Bush does a good job representing America to the world, or not? |
 |
Americans' Views of the United States' Position in the World Have Changed Very Little Since Sept. 11
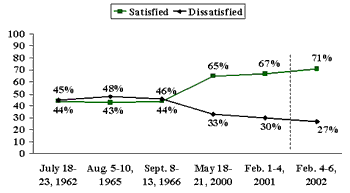
There has been surprisingly little change in Americans' satisfaction with the position of the United States in the world. Today, 71% of Americans say they are satisfied with the position of the United States in the world, up only slightly from 2000 and 2001. The recent numbers, however, are considerably higher than the corresponding numbers from the 1960s.
| Satisfaction With U.S. Position in the World |
 |
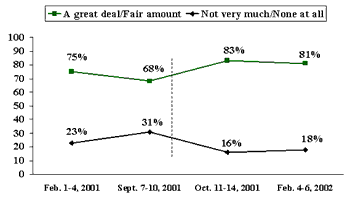
Following Sept. 11, there has been a slight increase in the public's trust in government to handle international problems. Currently, 81% express a great deal or fair amount of trust in the government, compared with 75% in February 2001.
| Trust in Government to Handle International Problems |
 |
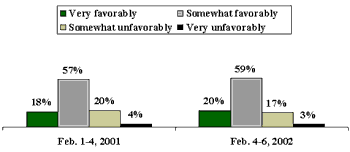
Overall, 79% of Americans believe the United States is viewed favorably in the eyes of the world, virtually unchanged from last year.
| In general, how do you think the United States rates in the eyes of the world -- very favorably, somewhat favorably, somewhat unfavorably, or very unfavorably? |
 |
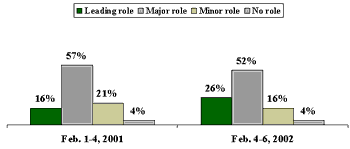
There has been a modest increase in the percentage of Americans who believe that the United States should take the leading role in solving international problems, from 16% in Feb. 2001 to 26% today. Only 20% of Americans now believe that the United States should play a minor role or no role at all in world affairs.
| U.S. Role in Solving International Problems |
 |
Saudi Arabia Took the Biggest Perceptual Hit in Last Year; Iraq, Iran Are Least Favorably Viewed Nations
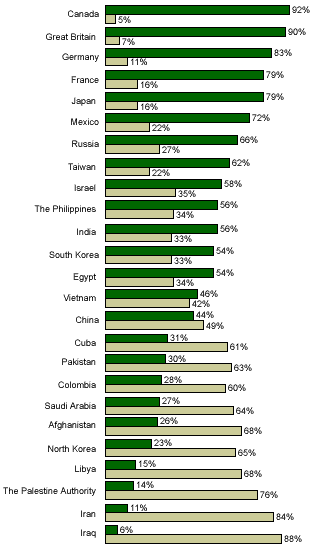
The current survey asked Americans to rate their opinions of a list of 25 countries -- some of which have been measured in this fashion for decades.
The basic pattern of the attitudes is not surprising:
- Canada, Great Britain, Germany, Japan and France are most favorably viewed by Americans.
- Iraq, Iran, The Palestinian Authority, Libya and North Korea are least favorably viewed.
| Favorability of Nations Around the World: Sorted by Percent "Total Favorable" |
 |
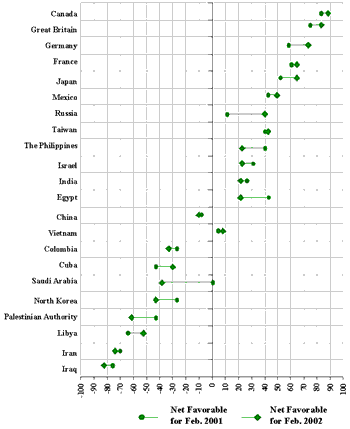
There have been several significant changes in these country evaluations since last year. In particular, Saudi Arabia and Egypt have lost considerable ground. Saudi Arabia went from a net +1 positive rating to a net -37 negative rating. Egypt went from a net +42 rating to a net +20 rating. On the other hand, Americans' ratings of Russia improved from a net +10 rating to a net +39 rating.
 |
Americans Have Become More Likely to Believe that the Development of Peace Between the Israelis and the Palestinians Is an Important Goal for the United States
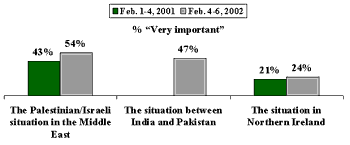
A majority of the American public, 54%, now believes the development of a peaceful solution to the conflict between the Israelis and the Palestinians should be an important foreign policy goal for the United States, up from 43% who felt this way last February. Americans see resolving the Israeli-Palestinian conflict as a more important foreign policy goal than resolving the India-Pakistan conflict and much more important than resolving the Catholic-Protestant conflict in Northern Ireland.
| As far as you are concerned, should the development of a peaceful solution to … be a very important foreign policy goal of the United States, a somewhat important goal, not too important, or not an important goal at all? |
 |
Americans Still Overwhelmingly Side With Israel in the Middle East Conflict, but Remain Pessimistic That Peace Will Ever Come to That Region
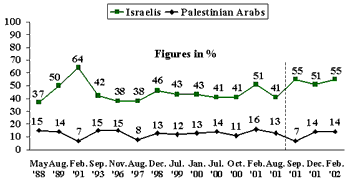
A majority of Americans say they sympathize more with the Israelis than with the Palestinian Arabs; only 14% sympathize more with the Palestinians. These numbers have been consistent over time and show little change since Sept. 11.
| Sympathies in the Middle East Situation |
 |
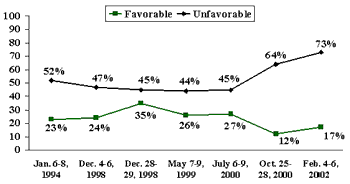
However, Americans have grown increasingly negative in their evaluations of Palestinian leader Yasser Arafat. Currently, 73% of Americans view him unfavorably.
| Opinion About Yasser Arafat |
 |
At the same time, opinions about Israeli Prime Minister Ariel Sharon are much more positive.
| Opinion About Ariel Sharon |
 |
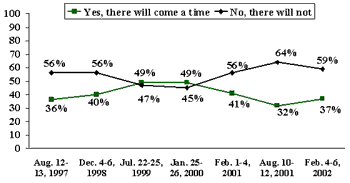
Just 37% of Americans believe there will come a time when Israel and the Arab nations will settle their differences and live in peace, while 59% think this time will never come. These attitudes have changed little since Sept. 11, but are more pessimistic than they were in July 1999 and January 2000, when a plurality thought peace was possible.
| Peace for Israel and the Arab Nations? |
 |
Surprisingly, There Has Been Little Change in Americans' Evaluation of the Nation's Defense Capabilities
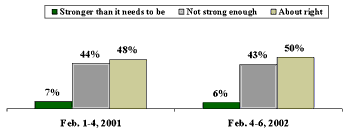
Half of the public believes the nation's defense is currently at about the right strength, essentially the same percentage who believed that in February 2001. Currently, 43% say the nation's defense is not strong enough, compared to 44% last year.
| Do you, yourself, feel that our national defense is stronger now than it needs to be, not strong enough, or about right at the present time? |
 |
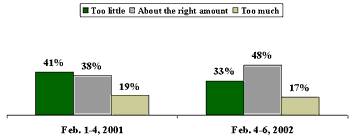
Nearly half the public feels the federal government spends the right amount on national defense, up from 38% last year. Despite large increases in defense spending in this year's budget, only 17% say the nation spends too much on defense, little changed from last year (19%). There has been a drop in the percentage of Americans saying the government spends too little on defense, from 41% last year to 33% this year.
| There is much discussion as to the amount of money the government in Washington should spend for national defense and military purposes. How do you feel about this? Do you think we are spending too little, about the right amount, or too much? |
 |
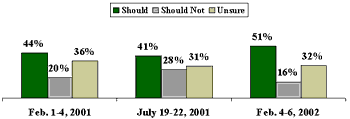
Americans have become more likely to support the development of a missile defense system. Now, a majority of Americans (51%) support spending the money to build such a system, compared with just 41% support in July 2001.
| Recently there has been some discussion about the possibility of the United States building a defense system against nuclear missiles. Do you think the government should or should not spend the money that would be required for research and possible development of such a system, or are you unsure? |
 |
Americans' Views on Foreign Aid Have Held Steady
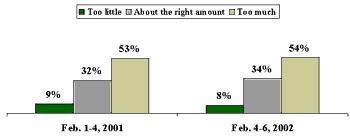
Fifty-four percent of Americans say the United States spends too much on foreign aid, compared with 53% last year.
| Turning to the issue of foreign aid, do you think the United States is now spending -- too little on foreign aid, about the right amount, or too much on foreign aid? |
 |
Evaluations of the United Nations Virtually Unchanged
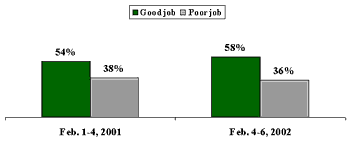
Americans' views about the job the United Nations is doing are only slightly more positive this year (58% say it is doing a good job) than last year (54%).
| Do you think the United Nations is doing a good job or a poor job in trying to solve the problems it has had to face? |
 |
GALLUP POLL NEWS SERVICE
Gallup Poll Social Series: World Affairs
-- FINAL TOPLINE --
Results are based on telephone interviews with - 1,011 - National Adults, aged 18+, conducted February 4-6, 2002. For results based on the total sample of National Adults, one can say with 95% confidence that the margin of sampling error is ±3 percentage points.
Do you approve or disapprove of the way George W. Bush is handling -- [ROTATED]? How about -- ?
A. The economy
|
Approve |
Disapprove |
No opinion |
|
|
% |
% |
% |
|
|
(NA) 2002 Feb 4-6 |
66 |
30 |
4 |
|
(NA) 2002 Jan 25-27 |
64 |
30 |
6 |
|
(NA) 2001 Nov 2-4 ^ |
71 |
24 |
5 |
|
(NA) 2001 Oct 5-6 |
72 |
23 |
5 |
|
(NA) 2001 Jul 10-11 |
54 |
36 |
10 |
|
(NA) 2001 May 18-20 |
51 |
41 |
8 |
|
(NA) 2001 Apr 20-22 ^ |
55 |
38 |
7 |
|
(NA) 2001 Mar 9-11 |
55 |
32 |
13 |
|
(NA) 2001 Feb 1-4 |
53 |
27 |
20 |
|
^ Asked of half sample. |
|||
B. Foreign affairs
|
Approve |
Disapprove |
No opinion |
|
|
% |
% |
% |
|
|
(NA) 2002 Feb 4-6 |
79 |
16 |
5 |
|
(NA) 2002 Jan 25-27 |
83 |
14 |
3 |
|
(NA) 2001 Oct 5-6 |
81 |
14 |
5 |
|
(NA) 2001 Jul 10-11 |
54 |
33 |
13 |
|
(NA) 2001 May 18-20 |
55 |
35 |
10 |
|
(NA) 2001 Apr 20-22 ^ |
56 |
31 |
13 |
|
(NA) 2001 Mar 9-11 |
52 |
27 |
21 |
|
(NA) 2001 Feb 1-4 |
46 |
21 |
33 |
|
^ Asked of half sample. |
|||
Do you think leaders of other countries around the world have respect for George W. Bush, or do you think they don't have much respect for him?
|
Respect him |
Don't have much respect for him |
No |
||
|
% |
% |
% |
||
|
George W. Bush |
||||
|
2002 Feb 4-6 |
75 |
21 |
4 |
|
|
2001 Jul 19-22 |
45 |
47 |
8 |
|
|
2001 Jun 8-10 |
40 |
46 |
14 |
|
|
2001 Feb 1-4 |
49 |
38 |
13 |
|
|
Bill Clinton Trend |
||||
|
2000 May 18-21 |
44 |
51 |
5 |
|
|
1994 Sep 23-25 |
41 |
55 |
5 |
|
|
^ |
Asked of a half sample. |
|||
In general, how closely do you follow news about foreign countries around the world, including relations between the United States and other countries -- very closely, somewhat closely, not too closely, or not at all?
|
Very |
Somewhat closely |
Not too closely |
Not at all closely |
No opinion |
|
|
% |
% |
% |
% |
% |
|
|
2002 Feb 4-6 |
26 |
56 |
15 |
3 |
* |
|
2001 Feb 1-4 |
16 |
55 |
25 |
4 |
* |
|
2000 May 18-21 |
15 |
50 |
27 |
7 |
1 |
On the whole, would you say that you are satisfied or dissatisfied with the position of the United States in the world today?
|
|
|
No |
|
|
% |
% |
% |
|
|
2002 Feb 4-6 |
71 |
27 |
2 |
|
2001 Feb 1-4 |
67 |
30 |
3 |
|
2000 May 18-21 |
65 |
33 |
2 |
|
1966 Sep 8-13 |
44 |
46 |
10 |
|
1965 Aug 5-10 |
43 |
48 |
8 |
|
1962 Jul 18-23 |
44 |
45 |
12 |
How much trust and confidence do you have in our federal government in Washington when it comes to handling [READ A-B] -- a great deal, a fair amount, not very much, or none at all?
A. International Problems
|
Great |
Fair |
Not very |
None |
No |
|
|
% |
% |
% |
% |
% |
|
|
2002 Feb 4-6 |
21 |
60 |
14 |
4 |
1 |
|
2001 Oct 11-14 |
36 |
47 |
13 |
3 |
1 |
|
2001 Sep 7-10 |
14 |
54 |
25 |
6 |
1 |
|
2001 Feb 1-4 |
12 |
63 |
19 |
4 |
2 |
|
2000 Jul 6-9 |
17 |
55 |
21 |
6 |
1 |
|
2000 May 18-21 |
8 |
45 |
34 |
12 |
1 |
|
1998 Dec 28-29 |
9 |
52 |
30 |
7 |
2 |
|
1997 May 30-Jun 1 |
10 |
58 |
23 |
7 |
2 |
|
1976 Jun |
8 |
48 |
33 |
7 |
4 |
|
1974 Apr |
24 |
49 |
18 |
4 |
3 |
|
1972 May |
20 |
55 |
20 |
2 |
4 |
B. Domestic Problems
|
Great |
Fair |
Not very |
None |
No |
|
|
% |
% |
% |
% |
% |
|
|
2002 Feb 4-6 |
12 |
59 |
23 |
5 |
1 |
|
2001 Oct 11-14 |
24 |
53 |
17 |
4 |
2 |
|
2001 Sep 7-10 |
6 |
54 |
31 |
8 |
1 |
|
2001 Feb 1-4 |
7 |
56 |
28 |
8 |
1 |
|
2000 Jul 6-9 |
10 |
48 |
30 |
10 |
2 |
|
2000 May 18-21 |
11 |
54 |
26 |
7 |
2 |
|
1998 Dec 28-29 |
11 |
54 |
26 |
7 |
2 |
|
1997 May 30-Jun 1 |
6 |
45 |
36 |
11 |
2 |
|
1976 Jun |
5 |
44 |
42 |
7 |
3 |
|
1974 Apr |
9 |
42 |
36 |
8 |
4 |
|
1972 May |
11 |
59 |
26 |
3 |
2 |
In general, how do you think the United States rates in the eyes of the world -- very favorably, somewhat favorably, somewhat unfavorably, or very unfavorably?
|
Very favorably |
Somewhat favorably |
Somewhat unfavorably |
Very unfavorably |
No opinion |
|
|
% |
% |
% |
% |
% |
|
|
2002 Feb 4-6 |
20 |
59 |
17 |
3 |
1 |
|
2001 Feb 1-4 |
18 |
57 |
20 |
4 |
1 |
|
2000 May 18-21 |
20 |
53 |
22 |
4 |
1 |
Next we would like you to think about the role the U.S. should play in trying to solve international problems. Do you think the U.S. should -- [ROTATED: take the leading role in world affairs, take a major role, but not the leading role, take a minor role, (or) take no role at all in world affairs]?
|
|
Major role |
|
|
No opinion |
|
|
% |
% |
% |
% |
% |
|
|
2002 Feb 4-6 |
26 |
52 |
16 |
4 |
2 |
|
2001 Feb 1-4 |
16 |
57 |
21 |
4 |
2 |
Turning to the issue of foreign aid, do you think the United States is now spending -- [ROTATED: too little on foreign aid, about the right amount, (or) too much on foreign aid]?
|
|
About the |
|
No opinion |
|
|
% |
% |
% |
% |
|
|
2002 Feb 4-6 |
8 |
34 |
54 |
4 |
|
2001 Feb 1-4 |
9 |
32 |
53 |
6 |
There is much discussion as to the amount of money the government in Washington should spend for national defense and military purposes. How do you feel about this? Do you think we are spending too little, about the right amount, or too much?
|
Too little |
About right |
Too much |
No opinion |
|
|
% |
% |
% |
% |
|
|
2002 Feb 4-6 |
33 |
48 |
17 |
2 |
|
2001 Feb 1-4 |
41 |
38 |
19 |
2 |
|
2000 Aug 24-27 |
40 |
34 |
20 |
6 |
|
2000 May 18-21 |
31 |
44 |
22 |
3 |
|
1999 May 7-9 |
28 |
35 |
32 |
5 |
|
1998 Nov 20-22 |
26 |
45 |
22 |
7 |
|
1993 Mar 29-31 |
17 |
38 |
42 |
3 |
|
1990 |
9 |
36 |
50 |
5 |
|
1987 |
14 |
36 |
44 |
6 |
|
1986 |
13 |
36 |
47 |
4 |
|
1985 |
11 |
36 |
46 |
7 |
|
1983 |
21 |
36 |
37 |
6 |
|
1982 |
16 |
31 |
41 |
12 |
|
1981 |
51 |
22 |
15 |
12 |
|
1976 |
22 |
32 |
36 |
10 |
|
1973 |
13 |
30 |
46 |
11 |
|
1971 |
11 |
31 |
50 |
8 |
|
1969 |
8 |
31 |
52 |
9 |
Do you, yourself, feel that our national defense is stronger now than it needs to be, not strong enough, or about right at the present time?
|
Stronger than needs to be |
Not strong enough |
About |
No |
||
|
% |
% |
% |
% |
||
|
2002 Feb 4-6 |
6 |
43 |
50 |
1 |
|
|
2001 Feb 1-4 |
7 |
44 |
48 |
1 |
|
|
2000 May 18-21 |
6 |
38 |
55 |
1 |
|
|
2000 Jan 13-16 |
6 |
39 |
52 |
3 |
|
|
1999 May 7-9 |
7 |
42 |
48 |
3 |
|
|
1990 Jan 4-7 |
16 |
17 |
64 |
3 |
|
|
1984 ^ |
15 |
36 |
46 |
3 |
|
|
^ |
Gallup/Newsweek |
||||
GALLUP POLL NEWS SERVICE
Gallup Poll Social Series: World Affairs
-- FINAL TOPLINE --
Results are based on telephone interviews with - 1,011 - National Adults, aged 18+, conducted February 4-6, 2002. For results based on the total sample of National Adults, one can say with 95% confidence that the margin of sampling error is ±3 percentage points.
Now thinking about the United Nations,
Do you think the United Nations is doing a good job or a poor job in trying to solve the problems it has had to face?
|
Good job |
Poor job |
No opinion |
|
|
% |
% |
% |
|
|
2002 Feb 4-6 |
58 |
36 |
6 |
|
2001 Feb 1-4 |
54 |
38 |
8 |
|
2000 May 18-21 |
52 |
43 |
5 |
|
1996 Feb 23-25 |
46 |
46 |
8 |
|
1995 Oct 19-22 |
36 |
49 |
15 |
|
1995 Sep 19-22 |
36 |
49 |
15 |
|
1995 Aug 28-30 |
35 |
56 |
9 |
|
1993 Jun 18-21 |
46 |
41 |
14 |
|
1993 Mar 29-31 |
52 |
44 |
5 |
|
1990 Oct 18-21 |
54 |
34 |
12 |
|
1985 Aug 13-15 |
28 |
54 |
18 |
|
1985 Feb 15-18 |
38 |
44 |
18 |
|
1983 Oct 7-10 |
36 |
51 |
13 |
|
1982 Jun 25-28 |
36 |
49 |
15 |
|
1980 Sep 12-15 |
31 |
53 |
16 |
|
1978 Feb 24-27 |
40 |
39 |
21 |
|
1975 Nov 21-24 |
32 |
51 |
16 |
|
1971 Oct 29-Nov 2 |
35 |
43 |
22 |
|
1970 Aug 25-Sep 1 |
44 |
40 |
16 |
|
1967 Jul 13-18 |
50 |
35 |
16 |
|
1953 Dec 11-16 |
55 |
30 |
15 |
Recently there has been some discussion about the possibility of the United States building a defense system against nuclear missiles. Do you think the government should or should not spend the money that would be required for research and possible development of such a system, or are you unsure?
|
Should |
Should not |
Unsure |
No opinion |
||
|
% |
% |
% |
% |
||
|
2002 Feb 4-6 |
51 |
16 |
32 |
1 |
|
|
2001 Jul 19-22 ^ |
41 |
28 |
31 |
* |
|
|
2001 Feb 1-4 |
44 |
20 |
36 |
* |
|
|
^ |
Asked of half sample. |
||||
How worried are you that you or someone in your family will become a victim of terrorism -- very worried, somewhat worried, not too worried, or not worried at all?
BASED ON -- 506 -- NATIONAL ADULTS IN FORM A; ±5 PCT. PTS.
|
|
|
|
Not |
Know a victim (vol.) |
|
||
|
% |
% |
% |
% |
% |
% |
||
|
2002 Feb 4-6 ^ |
8 |
27 |
39 |
25 |
0 |
1 |
|
|
2001 Nov 26-27 |
8 |
27 |
34 |
30 |
1 |
* |
|
|
2001 Nov 2-4 |
11 |
28 |
34 |
26 |
0 |
1 |
|
|
2001 Oct 19-21 † |
13 |
30 |
33 |
23 |
* |
1 |
|
|
2001 Oct 11-14 † |
18 |
33 |
35 |
14 |
* |
* |
|
|
2001 Oct 5-6 † |
24 |
35 |
27 |
14 |
* |
* |
|
|
2001 Sep 21-22 † |
14 |
35 |
32 |
18 |
* |
1 |
|
|
2001 Sep 14-15 † |
18 |
33 |
35 |
13 |
* |
1 |
|
|
2001 Sep 11 † ‡ |
23 |
35 |
24 |
16 |
1 |
1 |
|
|
2000 Apr 7-9 ^ |
4 |
20 |
41 |
34 |
-- |
1 |
|
|
1998 Aug 20 ‡ ♠ |
10 |
22 |
38 |
29 |
-- |
1 |
|
|
1996 Jul 20-21 ‡ |
13 |
26 |
34 |
27 |
-- |
* |
|
|
1996 Apr 9-10 ♣ |
13 |
22 |
33 |
32 |
-- |
* |
|
|
1995 Apr 21-23 ♣ |
14 |
28 |
33 |
24 |
-- |
1 |
|
|
^ |
Asked of a half sample. |
||||||
|
† |
WORDING: How worried are you that you or someone in your family will become a victim a terrorist attack -- very worried, somewhat worried, not too worried, or not worried at all? |
||||||
|
‡ |
Based on one night poll of national adults with a margin of error of ±4 pct. pts. |
||||||
|
♠ |
WORDING: How worried are you that someone in your family will become a victim of a terrorist attack similar to the bombing in Oklahoma City? |
||||||
|
♣ |
WORDING: How worried are you that you or someone in your family will become a victim of a terrorist attack similar to the bombing in Oklahoma City? |
||||||
How likely do you think it is that a terrorist attack of some sort will occur at the Winter Olympics taking place in Salt Lake City -- very likely, somewhat likely, somewhat unlikely, or very unlikely?
BASED ON -- 505 -- NATIONAL ADULTS IN FORM B; ±5 PCT. PTS.
|
Very |
Somewhat likely |
Somewhat unlikely |
Very |
No opinion |
||
|
% |
% |
% |
% |
% |
||
|
2002 Feb 4-6 |
11 |
37 |
32 |
18 |
2 |
|
|
1996 Jul 20-21 ^ |
13 |
38 |
28 |
18 |
3 |
|
|
^ |
WORDING: How likely do you think it is that a terrorist attack of some sort will occur at the Olympics currently taking place in Atlanta -- very likely, somewhat likely, somewhat unlikely, or very unlikely? Original poll scheduled Jul. 18-21. (N=508; ±5 PCT. PTS.) |
|||||
Next, I'd like your overall opinion of some foreign countries. First, is your overall opinion of [RANDOM ORDER]very favorable, mostly favorable, mostly unfavorable, or very unfavorable? How about -- [INSERT NEXT ITEM]?
|
2002 Feb 4-6 |
Very |
Mostly |
Mostly |
Very |
No |
Total |
Total |
|
% |
% |
% |
% |
% |
% |
% |
|
|
Canada |
49 |
43 |
4 |
1 |
3 |
92 |
5 |
|
Great Britain |
48 |
42 |
5 |
2 |
3 |
90 |
7 |
|
France |
23 |
56 |
13 |
3 |
5 |
79 |
16 |
|
Germany |
22 |
61 |
8 |
3 |
6 |
83 |
11 |
|
Japan |
17 |
62 |
12 |
4 |
5 |
79 |
16 |
|
Mexico |
16 |
56 |
17 |
5 |
6 |
72 |
22 |
|
Israel |
16 |
42 |
25 |
10 |
7 |
58 |
35 |
|
Russia |
11 |
55 |
20 |
7 |
7 |
66 |
27 |
|
Taiwan |
9 |
53 |
17 |
5 |
16 |
62 |
22 |
|
South Korea |
9 |
45 |
25 |
8 |
13 |
54 |
33 |
|
The Philippines |
8 |
48 |
27 |
7 |
10 |
56 |
34 |
|
India |
7 |
49 |
25 |
8 |
11 |
56 |
33 |
|
Egypt |
7 |
47 |
29 |
5 |
12 |
54 |
34 |
|
China |
6 |
38 |
37 |
12 |
7 |
44 |
49 |
|
Vietnam |
5 |
41 |
31 |
11 |
12 |
46 |
42 |
|
Colombia |
5 |
23 |
44 |
16 |
12 |
28 |
60 |
|
Cuba |
4 |
27 |
41 |
20 |
8 |
31 |
61 |
|
Pakistan |
4 |
26 |
42 |
21 |
7 |
30 |
63 |
|
Saudi Arabia |
4 |
23 |
42 |
22 |
9 |
27 |
64 |
|
Afghanistan |
4 |
22 |
34 |
34 |
6 |
26 |
68 |
|
North Korea |
3 |
20 |
38 |
27 |
12 |
23 |
65 |
|
The Palestine Authority |
3 |
11 |
44 |
32 |
10 |
14 |
76 |
|
Libya |
2 |
13 |
41 |
27 |
17 |
15 |
68 |
|
Iran |
2 |
9 |
46 |
38 |
5 |
11 |
84 |
|
Iraq |
2 |
4 |
39 |
49 |
6 |
6 |
88 |
FAVORABILITY OF NATIONS TREND
A. Afghanistan
|
Very |
Mostly |
Mostly |
Very |
No |
Total |
Total |
|
|
% |
% |
% |
% |
% |
% |
% |
|
|
2002 Feb 4-6 |
4 |
22 |
34 |
34 |
6 |
26 |
68 |
B. Canada
|
Very |
Mostly |
Mostly |
Very |
No |
Total |
Total |
|
|
% |
% |
% |
% |
% |
% |
% |
|
|
2002 Feb 4-6 |
49 |
43 |
4 |
1 |
3 |
92 |
5 |
|
2001 Feb 1-4 ^ |
51 |
39 |
4 |
3 |
3 |
90 |
7 |
|
1999 Feb 8-9 |
43 |
47 |
2 |
1 |
7 |
90 |
3 |
|
1996 Mar 8-10 |
47 |
42 |
5 |
* |
6 |
89 |
5 |
|
1992 Feb 6-9 |
40 |
51 |
4 |
1 |
4 |
91 |
5 |
|
1991 Mar 14-17 |
48 |
43 |
2 |
1 |
6 |
91 |
3 |
|
1989 Aug 10-13 |
49 |
44 |
1 |
1 |
5 |
93 |
2 |
|
1989 Feb 28-Mar 2 |
45 |
47 |
2 |
1 |
2 |
92 |
3 |
|
1987 Nov 6-Dec 4 |
51 |
42 |
2 |
1 |
4 |
93 |
3 |
C. China
|
Very |
Mostly |
Mostly |
Very |
No |
Total |
Total |
|
|
% |
% |
% |
% |
% |
% |
% |
|
|
2002 Feb 4-6 |
6 |
38 |
37 |
12 |
7 |
44 |
49 |
|
2001 Feb 1-4 ^ |
5 |
40 |
31 |
17 |
7 |
45 |
48 |
|
2000 Nov 13-15 |
5 |
31 |
39 |
18 |
7 |
36 |
57 |
|
2000 Mar 17-19 |
6 |
29 |
40 |
16 |
9 |
35 |
56 |
|
2000 Jan 25-26 |
4 |
29 |
33 |
18 |
16 |
33 |
51 |
|
1999 May 7-9 |
5 |
33 |
38 |
18 |
6 |
38 |
56 |
|
1999 Mar 12-14 ^ |
2 |
32 |
39 |
20 |
7 |
34 |
59 |
|
1999 Feb 8-9 |
8 |
31 |
34 |
16 |
11 |
39 |
50 |
|
1998 Jul 7-8 |
6 |
38 |
36 |
11 |
9 |
44 |
47 |
|
1998 Jun 22-23 |
5 |
34 |
42 |
9 |
10 |
39 |
51 |
|
1997 Jun 26-29 |
5 |
28 |
36 |
14 |
17 |
33 |
50 |
|
1996 Mar 8-10 |
6 |
33 |
35 |
16 |
10 |
39 |
51 |
|
1994 Feb 26-28 |
4 |
36 |
38 |
15 |
7 |
40 |
53 |
|
1991 Mar 14-17 |
5 |
30 |
35 |
18 |
12 |
35 |
53 |
|
1989 Aug 10-13 |
5 |
29 |
32 |
22 |
12 |
34 |
54 |
|
1989 Feb 28-Mar 2 |
12 |
60 |
10 |
3 |
15 |
72 |
13 |
|
1985 Feb 22-Mar 3 |
5 |
33 |
35 |
16 |
11 |
38 |
51 |
|
1979 Sep |
18 |
46 |
18 |
7 |
10 |
64 |
25 |
D. Colombia
|
Very |
Mostly |
Mostly |
Very |
No |
Total |
Total |
|
|
% |
% |
% |
% |
% |
% |
% |
|
|
2002 Feb 4-6 |
5 |
23 |
44 |
16 |
12 |
28 |
60 |
|
2001 Feb 1-4 ^ |
7 |
23 |
38 |
21 |
11 |
30 |
59 |
E. Cuba
|
Very |
Mostly |
Mostly |
Very |
No |
Total |
Total |
|
|
% |
% |
% |
% |
% |
% |
% |
|
|
2002 Feb 4-6 |
4 |
27 |
41 |
20 |
8 |
31 |
61 |
|
2001 Feb 1-4 ^ |
4 |
23 |
41 |
27 |
5 |
27 |
68 |
|
1999 May 7-9 |
4 |
20 |
45 |
24 |
7 |
24 |
69 |
|
1999 Mar 19-21 |
4 |
28 |
48 |
13 |
7 |
32 |
61 |
|
1996 Mar 8-10 ^ |
2 |
8 |
40 |
41 |
9 |
10 |
81 |
F. Egypt
|
Very |
Mostly |
Mostly |
Very |
No |
Total |
Total |
|
|
% |
% |
% |
% |
% |
% |
% |
|
|
2002 Feb 4-6 |
7 |
47 |
29 |
5 |
12 |
54 |
34 |
|
2001 Feb 1-4 ^ |
11 |
54 |
19 |
4 |
12 |
65 |
23 |
|
1996 Mar 8-10 |
10 |
48 |
19 |
5 |
17 |
58 |
24 |
|
1991 Aug 8-11 |
9 |
54 |
15 |
5 |
17 |
63 |
20 |
|
1991 Mar 14-17 |
11 |
55 |
14 |
3 |
17 |
66 |
17 |
|
1991 Jan 30-Feb 2 |
10 |
56 |
12 |
3 |
19 |
66 |
15 |
G. France
|
Very |
Mostly |
Mostly |
Very |
No |
Total |
Total |
|
|
% |
% |
% |
% |
% |
% |
% |
|
|
2002 Feb 4-6 |
23 |
56 |
13 |
3 |
5 |
79 |
16 |
|
2001 Feb 1-4 ^ |
22 |
55 |
12 |
5 |
6 |
77 |
17 |
|
1999 Feb 8-9 |
17 |
54 |
14 |
4 |
11 |
71 |
18 |
|
1996 Mar 8-10 |
15 |
55 |
16 |
4 |
11 |
70 |
20 |
|
1991 Mar 14-17 |
18 |
61 |
9 |
3 |
9 |
79 |
12 |
|
1991 Jan 30-Feb 2 |
17 |
57 |
11 |
4 |
11 |
74 |
15 |
H. Germany
|
Very |
Mostly |
Mostly |
Very |
No |
Total |
Total |
|
|
% |
% |
% |
% |
% |
% |
% |
|
|
2002 Feb 4-6 |
22 |
61 |
8 |
3 |
6 |
83 |
11 |
|
2001 Feb 1-4 ^ |
20 |
55 |
9 |
7 |
9 |
75 |
16 |
|
2000 Nov 13-15 |
16 |
61 |
11 |
5 |
7 |
77 |
16 |
|
1999 Nov 4-7 |
11 |
66 |
13 |
5 |
5 |
77 |
18 |
|
1999 Feb 8-9 |
18 |
61 |
7 |
4 |
10 |
79 |
11 |
|
1996 Mar 8-10 |
17 |
58 |
13 |
3 |
9 |
75 |
16 |
|
1993 Jun 29-30 |
10 |
53 |
19 |
9 |
9 |
63 |
28 |
|
1992 Feb 6-9 |
17 |
57 |
14 |
6 |
6 |
74 |
20 |
|
1991 Mar 14-17 |
16 |
62 |
11 |
3 |
8 |
78 |
14 |
GALLUP POLL NEWS SERVICE
Gallup Poll Social Series: World Affairs
-- FINAL TOPLINE --
Results are based on telephone interviews with - 1,011 - National Adults, aged 18+, conducted February 4-6, 2002. For results based on the total sample of National Adults, one can say with 95% confidence that the margin of sampling error is ±3 percentage points.
FAVORABILITY OF NATIONS TREND, continued
I. Great Britain
|
Very |
Mostly |
Mostly |
Very |
No |
Total |
Total |
|
|
% |
% |
% |
% |
% |
% |
% |
|
|
2002 Feb 4-6 |
48 |
42 |
5 |
2 |
3 |
90 |
7 |
|
2001 Feb 1-4 ^ |
41 |
44 |
6 |
3 |
6 |
85 |
9 |
|
2000 Nov 13-15 |
27 |
55 |
7 |
3 |
8 |
82 |
10 |
|
1999 May 7-9 |
37 |
52 |
5 |
3 |
3 |
89 |
8 |
|
1999 Feb 8-9 |
34 |
50 |
4 |
3 |
9 |
84 |
7 |
|
1996 Mar 8-10 |
30 |
51 |
8 |
2 |
9 |
81 |
10 |
|
1991 Mar 14-17 |
49 |
40 |
4 |
1 |
6 |
89 |
5 |
|
1991 Jan 30-Feb 2 |
45 |
45 |
3 |
1 |
6 |
90 |
4 |
|
1989 Feb 28-Mar 2 |
29 |
57 |
4 |
3 |
7 |
86 |
7 |
J. India
|
Very |
Mostly |
Mostly |
Very |
No |
Total |
Total |
|
|
% |
% |
% |
% |
% |
% |
% |
|
|
2002 Feb 4-6 |
7 |
49 |
25 |
8 |
11 |
56 |
33 |
|
2001 Feb 1-4 ^ |
8 |
50 |
24 |
6 |
12 |
58 |
30 |
|
2000 Mar 17-19 |
7 |
40 |
30 |
8 |
15 |
47 |
38 |
K. Iran
|
Very |
Mostly |
Mostly |
Very |
No |
Total |
Total |
|
|
% |
% |
% |
% |
% |
% |
% |
|
|
2002 Feb 4-6 |
2 |
9 |
46 |
38 |
5 |
11 |
84 |
|
2001 Feb 1-4 ^ |
2 |
10 |
45 |
38 |
5 |
12 |
83 |
|
1996 Mar 8-10 |
1 |
5 |
38 |
46 |
10 |
6 |
84 |
|
1991 Aug 8-11 |
1 |
12 |
44 |
35 |
9 |
13 |
79 |
|
1991 Mar 14-17 |
3 |
11 |
41 |
35 |
10 |
14 |
76 |
|
1991 Jan 30-Feb 2 |
2 |
11 |
39 |
40 |
8 |
13 |
79 |
|
1989 Aug 10-13 |
1 |
4 |
27 |
62 |
6 |
5 |
89 |
|
1989 Feb 28-Mar 2 |
1 |
4 |
27 |
62 |
6 |
5 |
89 |
L. Iraq
|
Very |
Mostly |
Mostly |
Very |
No |
Total |
Total |
|
|
% |
% |
% |
% |
% |
% |
% |
|
|
2002 Feb 4-6 |
2 |
4 |
39 |
49 |
6 |
6 |
88 |
|
2001 Feb 1-4 ^ |
2 |
7 |
34 |
51 |
6 |
9 |
85 |
|
2000 Nov 13-15 |
2 |
4 |
35 |
53 |
6 |
6 |
88 |
|
1999 May 7-9 |
1 |
4 |
38 |
53 |
4 |
5 |
91 |
|
1999 Feb 8-9 |
2 |
5 |
27 |
60 |
6 |
7 |
87 |
|
1996 Mar 8-10 |
1 |
5 |
34 |
52 |
8 |
6 |
86 |
|
1992 Feb 6-9 |
1 |
3 |
30 |
62 |
4 |
4 |
92 |
|
1991 Aug 8-11 |
1 |
6 |
32 |
54 |
7 |
7 |
86 |
|
1991 Mar 14-17 |
2 |
5 |
26 |
62 |
5 |
7 |
88 |
|
1991 Jan 30-Feb 2 |
* |
3 |
17 |
73 |
7 |
3 |
90 |
M. Israel
|
Very |
Mostly |
Mostly |
Very |
No |
Total |
Total |
|
|
% |
% |
% |
% |
% |
% |
% |
|
|
2002 Feb 4-6 |
16 |
42 |
25 |
10 |
7 |
58 |
35 |
|
2001 Feb 1-4 ^ |
18 |
45 |
20 |
12 |
5 |
63 |
32 |
|
2000 Mar 17-19 |
16 |
46 |
20 |
8 |
10 |
62 |
28 |
|
2000 Jan 25-26 |
11 |
43 |
21 |
7 |
18 |
54 |
28 |
|
1999 May 7-9 |
15 |
53 |
19 |
6 |
7 |
68 |
25 |
|
1999 Feb 8-9 |
18 |
48 |
16 |
7 |
11 |
66 |
23 |
|
1996 Mar 8-10 |
17 |
45 |
18 |
11 |
9 |
62 |
29 |
|
1992 Feb 6-9 |
12 |
36 |
27 |
16 |
9 |
48 |
43 |
|
1991 Nov 21-14 |
11 |
36 |
26 |
11 |
16 |
47 |
37 |
|
1991 Sep 26-29 |
11 |
45 |
25 |
9 |
10 |
56 |
34 |
|
1991 Aug 8-11 |
15 |
47 |
19 |
6 |
12 |
62 |
25 |
|
1991 Mar 14-17 |
20 |
49 |
16 |
7 |
8 |
69 |
23 |
|
1991 Jan 30-Feb 2 |
28 |
51 |
10 |
3 |
8 |
79 |
13 |
|
1989 Aug 10-13 |
11 |
34 |
29 |
16 |
10 |
45 |
45 |
|
1989 Feb 28-Mar 2 |
8 |
41 |
25 |
13 |
13 |
49 |
38 |
N. Japan
|
Very |
Mostly |
Mostly |
Very |
No |
Total |
Total |
|
|
% |
% |
% |
% |
% |
% |
% |
|
|
2002 Feb 4-6 |
17 |
62 |
12 |
4 |
5 |
79 |
16 |
|
2001 Feb 1-4 ^ |
17 |
56 |
14 |
7 |
6 |
73 |
21 |
|
2000 Nov 13-15 |
13 |
57 |
17 |
5 |
8 |
70 |
22 |
|
1999 May 7-9 |
14 |
61 |
15 |
5 |
5 |
75 |
20 |
|
1999 Feb 8-9 |
15 |
54 |
16 |
5 |
10 |
69 |
21 |
|
1996 Mar 8-10 |
12 |
53 |
18 |
7 |
10 |
65 |
25 |
|
1995 Nov 6-8 |
4 |
42 |
34 |
11 |
9 |
46 |
45 |
|
1994 Jun 11-12 |
6 |
40 |
32 |
12 |
10 |
46 |
44 |
|
1994 Feb 26-28 |
7 |
47 |
28 |
14 |
4 |
54 |
42 |
|
1993 Jun 29-30 |
7 |
41 |
30 |
16 |
6 |
48 |
46 |
|
1992 Feb 6-9 |
9 |
38 |
28 |
22 |
3 |
47 |
50 |
|
1991 Nov 21-24 |
7 |
41 |
29 |
12 |
11 |
48 |
41 |
|
1991 Mar 14-17 |
10 |
55 |
19 |
7 |
9 |
65 |
26 |
|
1991 Jan 30-Feb 2 |
11 |
51 |
21 |
9 |
8 |
62 |
30 |
|
1989 Aug 10-13 |
10 |
48 |
23 |
10 |
9 |
58 |
33 |
|
1989 Feb 28-Mar 2 |
12 |
57 |
16 |
7 |
8 |
69 |
23 |
O. Libya
|
Very |
Mostly |
Mostly |
Very |
No |
Total |
Total |
|
|
% |
% |
% |
% |
% |
% |
% |
|
|
2002 Feb 4-6 |
2 |
13 |
41 |
27 |
17 |
15 |
68 |
|
2001 Feb 1-4 ^ |
2 |
9 |
40 |
35 |
14 |
11 |
75 |
P. Mexico
|
Very |
Mostly |
Mostly |
Very |
No |
Total |
Total |
|
|
% |
% |
% |
% |
% |
% |
% |
|
|
2002 Feb 4-6 |
16 |
56 |
17 |
5 |
6 |
72 |
22 |
|
2001 Feb 1-4 ^ |
17 |
50 |
17 |
9 |
7 |
67 |
26 |
|
1999 Feb 8-9 |
12 |
43 |
26 |
8 |
11 |
55 |
34 |
|
1996 Mar 8-10 |
11 |
46 |
23 |
9 |
11 |
57 |
32 |
|
1993 Jun 29-30 |
7 |
36 |
35 |
14 |
8 |
43 |
49 |
|
1991 Mar 14-17 |
12 |
53 |
18 |
4 |
13 |
65 |
22 |
|
1989 Feb 28-Mar 2 |
7 |
55 |
21 |
6 |
11 |
62 |
27 |
GALLUP POLL NEWS SERVICE
Gallup Poll Social Series: World Affairs
-- FINAL TOPLINE --
Results are based on telephone interviews with - 1,011 - National Adults, aged 18+, conducted February 4-6, 2002. For results based on the total sample of National Adults, one can say with 95% confidence that the margin of sampling error is ±3 percentage points.
FAVORABILITY OF NATIONS TREND, continued
Q. North Korea
|
Very |
Mostly |
Mostly |
Very |
No |
Total |
Total |
|
|
% |
% |
% |
% |
% |
% |
% |
|
|
2002 Feb 4-6 |
3 |
20 |
38 |
27 |
12 |
23 |
65 |
|
2001 Feb 1-4 ^ |
3 |
28 |
37 |
22 |
10 |
31 |
59 |
|
2000 Nov 13-15 |
3 |
23 |
41 |
22 |
11 |
26 |
63 |
R. Pakistan
|
Very |
Mostly |
Mostly |
Very |
No |
Total |
Total |
|
|
% |
% |
% |
% |
% |
% |
% |
|
|
2002 Feb 4-6 |
4 |
26 |
42 |
21 |
7 |
30 |
63 |
|
2000 Mar 17-19 |
2 |
19 |
39 |
20 |
20 |
21 |
59 |
S. The Philippines
|
Very |
Mostly |
Mostly |
Very |
No |
Total |
Total |
|
|
% |
% |
% |
% |
% |
% |
% |
|
|
2002 Feb 4-6 |
8 |
48 |
27 |
7 |
10 |
56 |
34 |
|
2001 Feb 1-4 ^ |
12 |
51 |
19 |
6 |
12 |
63 |
25 |
T. Russia
|
Very |
Mostly |
Mostly |
Very |
No |
Total |
Total |
|
|
% |
% |
% |
% |
% |
% |
% |
|
|
2002 Feb 4-6 |
11 |
55 |
20 |
7 |
7 |
66 |
27 |
|
2001 Feb 1-4 ^ |
6 |
46 |
27 |
15 |
6 |
52 |
42 |
|
2000 Nov 13-15 |
5 |
35 |
39 |
14 |
7 |
40 |
53 |
|
2000 Mar 17-19 |
5 |
35 |
39 |
12 |
9 |
40 |
51 |
|
1999 Nov 4-7 |
4 |
34 |
44 |
14 |
4 |
38 |
58 |
|
1999 May 7-9 |
4 |
42 |
36 |
13 |
5 |
46 |
49 |
|
1999 Apr 13-14 |
3 |
30 |
45 |
14 |
8 |
33 |
59 |
|
1999 Feb 8-9 |
6 |
38 |
34 |
10 |
12 |
44 |
44 |
|
1997 Nov 21-23 |
7 |
49 |
29 |
7 |
8 |
56 |
36 |
|
1996 Mar 8-10 |
6 |
46 |
29 |
10 |
9 |
52 |
39 |
|
1995 Apr 21-24 |
5 |
44 |
32 |
12 |
7 |
49 |
44 |
|
1994 Feb 26-28 |
8 |
48 |
28 |
11 |
5 |
56 |
39 |
|
1992 Feb 6-9 |
12 |
45 |
20 |
13 |
10 |
57 |
33 |
|
1991 Nov 21-24 |
7 |
45 |
24 |
12 |
12 |
52 |
36 |
|
1991 Aug 23-25 |
9 |
51 |
22 |
9 |
9 |
60 |
31 |
|
1991 Aug 8-11 |
11 |
55 |
19 |
6 |
9 |
66 |
25 |
|
1991 Mar 14-17 |
6 |
44 |
32 |
10 |
8 |
50 |
42 |
|
1991 Jan 30-Feb 2 |
8 |
49 |
26 |
9 |
8 |
57 |
35 |
|
1990 Sep 10-11 |
7 |
51 |
23 |
9 |
10 |
58 |
32 |
|
1990 May 17-20 |
7 |
48 |
24 |
8 |
13 |
55 |
32 |
|
1990 Aug 10-13 |
8 |
43 |
27 |
13 |
9 |
51 |
40 |
|
1989 Feb 28-Mar 2 |
7 |
55 |
20 |
9 |
9 |
62 |
29 |
|
1989-1992 WORDING: Soviet Union |
|||||||
U. Saudi Arabia
|
Very |
Mostly |
Mostly |
Very |
No |
Total |
Total |
|
|
% |
% |
% |
% |
% |
% |
% |
|
|
2002 Feb 4-6 |
4 |
23 |
42 |
22 |
9 |
27 |
64 |
|
2001 Feb 1-4 ^ |
7 |
40 |
28 |
18 |
7 |
47 |
46 |
|
1991 Aug 8-11 |
11 |
45 |
21 |
12 |
11 |
56 |
33 |
V. South Korea
|
Very |
Mostly |
Mostly |
Very |
No |
Total |
Total |
|
|
% |
% |
% |
% |
% |
% |
% |
|
|
2002 Feb 4-6 |
9 |
45 |
25 |
8 |
13 |
54 |
33 |
|
2000 Nov 13-15 |
5 |
44 |
28 |
10 |
13 |
49 |
38 |
|
1991 Mar 14-17 |
6 |
41 |
22 |
8 |
23 |
47 |
30 |
W. Taiwan
|
Very |
Mostly |
Mostly |
Very |
No |
Total |
Total |
|
|
% |
% |
% |
% |
% |
% |
% |
|
|
2002 Feb 4-6 |
9 |
53 |
17 |
5 |
16 |
62 |
22 |
|
2001 Feb 1-4 ^ |
11 |
52 |
14 |
8 |
15 |
63 |
22 |
|
2000 Mar 17-19 |
10 |
37 |
27 |
10 |
16 |
47 |
37 |
|
1996 Mar 8-10 |
10 |
49 |
17 |
5 |
19 |
59 |
22 |
X. The Palestinian Authority
|
Very |
Mostly |
Mostly |
Very |
No |
Total |
Total |
|
|
% |
% |
% |
% |
% |
% |
% |
|
|
2002 Feb 4-6 |
3 |
11 |
44 |
32 |
10 |
14 |
76 |
|
2001 Feb 1-4 ^ |
4 |
18 |
39 |
24 |
15 |
22 |
63 |
|
2000 Jan 25-26 |
3 |
18 |
36 |
16 |
27 |
21 |
52 |
Y. Vietnam
|
Very |
Mostly |
Mostly |
Very |
No |
Total |
Total |
|
|
% |
% |
% |
% |
% |
% |
% |
|
|
2002 Feb 4-6 |
5 |
41 |
31 |
11 |
12 |
46 |
42 |
|
2001 Feb 1-4 ^ |
7 |
39 |
30 |
14 |
10 |
46 |
44 |
|
2000 Nov 13-15 |
3 |
33 |
37 |
16 |
11 |
36 |
53 |
|
^ |
Asked of a half sample. |
Next, thinking about trade,
What do you think foreign trade means for America? Do you see foreign trade more as - an opportunity for economic growth through increased U.S. exports or a threat to the economy from foreign imports?
|
|
A threat to the economy from foreign imports |
BOTH |
NEITHER (vol.) |
No |
|
|
% |
% |
% |
% |
% |
|
|
2002 Feb 4-6 |
52 |
39 |
6 |
1 |
2 |
|
2001 Feb 1-4 |
51 |
37 |
8 |
1 |
3 |
|
2000 May 18-21 |
56 |
36 |
4 |
1 |
3 |
|
2000 Jan 13-16 |
54 |
35 |
4 |
1 |
6 |
|
1994 Nov 28-29 |
53 |
38 |
4 |
1 |
4 |
|
1992 Sept 11-15 |
44 |
48 |
2 |
1 |
5 |
As far as you are concerned, should the development of a peaceful solution to [INSERT ITEM, ROTATE START] be a very important foreign policy goal of the United States, a somewhat important goal, not too important, or not an important goal at all? Next, how about a peaceful solution to [INSERT NEXT ITEM]?
A. The Palestinian/Israeli situation in the Middle East
|
Very important |
Somewhat important |
Not too important |
Not at all important |
No |
|
|
% |
% |
% |
% |
% |
|
|
2002 Feb 4-6 |
54 |
30 |
7 |
6 |
3 |
|
2001 Feb 1-4 |
43 |
40 |
10 |
5 |
2 |
|
2000 Jul 6-9 |
34 |
43 |
14 |
6 |
3 |
|
2000 Jan 25-26 |
32 |
46 |
12 |
6 |
4 |
|
1999 Jul 22-25 |
41 |
41 |
9 |
6 |
3 |
|
1993 Sep 10-112 |
41 |
36 |
11 |
8 |
4 |
|
1991 Mar |
46 |
41 |
6 |
5 |
2 |
B. The situation in Northern Ireland
|
Very important |
Somewhat important |
Not too important |
Not at all important |
No |
|
|
% |
% |
% |
% |
% |
|
|
2002 Feb 4-6 |
24 |
46 |
16 |
7 |
7 |
|
2001 Feb 1-4 |
21 |
50 |
18 |
6 |
5 |
|
1999 Jul 22-25 |
23 |
46 |
16 |
8 |
7 |
C. The situation between India and Pakistan
|
Very important |
Somewhat important |
Not too important |
Not at all important |
No |
|
|
% |
% |
% |
% |
% |
|
|
2002 Feb 4-6 |
47 |
36 |
8 |
5 |
4 |
In the Middle East situation, are your sympathies more with the Israelis or more with the Palestinian Arabs?
|
|
Palestinian Arabs |
|
Neither |
No |
||
|
% |
% |
% |
% |
% |
||
|
2002 Feb 4-6 |
55 |
14 |
6 |
14 |
11 |
|
|
2001 Dec 14-16 |
51 |
14 |
5 |
17 |
13 |
|
|
2001 Sep 14-15 |
55 |
7 |
4 |
20 |
14 |
|
|
2001 Aug 10-12 |
41 |
13 |
7 |
18 |
21 |
|
|
2001 Feb 1-4 |
51 |
16 |
7 |
14 |
12 |
|
|
2000 Oct 13-14 ^ |
41 |
11 |
9 |
18 |
21 |
|
|
2000 Jul 6-9 |
41 |
14 |
5 |
18 |
22 |
|
|
2000 Jan 25-26 |
43 |
13 |
5 |
21 |
18 |
|
|
1999 Jul 22-25 |
43 |
12 |
11 |
19 |
15 |
|
|
1998 Dec 4-6 |
46 |
13 |
5 |
22 |
14 |
|
|
1997 Aug 12-13 |
38 |
8 |
5 |
19 |
30 |
|
|
1996 Nov 21-24 |
38 |
15 |
6 |
14 |
27 |
|
|
1993 Sep 10-12 |
42 |
15 |
6 |
17 |
20 |
|
|
1991 Feb |
64 |
7 |
19 |
-- |
10 |
|
|
1989 Aug |
50 |
14 |
15 |
-- |
21 |
|
|
1988 May 13-15 |
37 |
15 |
22 |
-- |
27 |
|
|
^ |
Based on interviews with 821 national adults; +/- 4 pct. pts. |
|||||
Do you think there will or will not come a time when Israel and the Arab nations will be able to settle their differences and live in peace?
|
Yes, there |
No, there |
No |
|
|
% |
% |
% |
|
|
2002 Feb 4-6 |
37 |
59 |
4 |
|
2001 Aug 10-12 |
32 |
64 |
4 |
|
2001 Feb 1-4 |
41 |
56 |
3 |
|
2000 Jan 25-26 |
49 |
45 |
6 |
|
1999 Jul 22-25 |
49 |
47 |
4 |
|
1998 Dec 4-6 |
40 |
56 |
4 |
|
1997 Aug 12-13 |
36 |
56 |
8 |
Next, we'd like to get your overall opinion of some people in the news. As I read each name, please say if you have a favorable or unfavorable opinion of this person -- or if you have never heard of him. How about - [ITEMS ROTATED]?
A. Israeli Prime Minister, Ariel Sharon
|
|
|
Never |
No |
|
|
% |
% |
% |
% |
|
|
2002 Feb 4-6 |
45 |
31 |
11 |
13 |
B. Palestinian Leader, Yasser Arafat
|
|
|
Never |
No |
|
|
% |
% |
% |
% |
|
|
2002 Feb 4-6 |
17 |
73 |
3 |
7 |
|
2000 Oct 25-28 |
12 |
64 |
6 |
18 |
|
2000 Jul 6-9 |
27 |
45 |
8 |
20 |
|
1999 May 7-9 |
26 |
44 |
6 |
24 |
|
1998 Dec 28-29 |
35 |
45 |
5 |
15 |
|
1998 Dec 4-6 |
24 |
47 |
9 |
20 |
|
1994 Jan 6-8^ |
23 |
52 |
8 |
17 |
|
^ Asked as "P.L.O. Chairman" |
||||