Note: The following is a slightly modified and expanded version of a paper presented at the 34th annual meeting of the Society for Neuroscience held in San Diego in October 2004.
Initial Participant Screening Procedures
We conducted this research in accordance with the Declaration of Helsinki, and the Ethical Committee of Nihon University School of Medicine approved it. Using outbound random digit dialing (RDD), we attempted to contact 2,000 households from a random pool of 14,800 eligible households within train commuting distance of Shinjuku 3-Chome where "Luxury Retailer I" was located. After being screened for conflicts (for instance employment at a department store or in any industry related to any aspect of this study), we asked potential participants to answer Gallup's CE11 items (see Appendix A on page 285 in Human Sigma) based on their experiences in the past six months at Luxury Retailer I and their "main bank" (the institution where they conduct a majority of their banking). Potential participants gave us permission to contact them later for follow-up studies.
Final Participant Selection Procedures
We choose participants in the fMRI portion of this research based on their level of engagement with Luxury Retailer I. We classified selected participants into three groups based on their level of engagement: highly engaged (CE11 score 4.76-4.44; average = 4.63, N = 4), moderately engaged (CE11 score 4.34-3.50; average = 3.91, N = 7), and disengaged (CE11 score 2.92-1.86; average = 2.60, N = 5). Later we asked participants to provide department store share of wallet data, including total department store purchases in the past year, as well as the amount and/or percentage spent at Luxury Retailer I in the past year.
We first called those participants with the highest and lowest CE11 scores who agreed to let us contact them again and asked them if they would participate in further research. This research involved answering a series of questions about their shopping behaviors and having pictures taken of their brains. Calling continued until a sufficient number of individuals in each group agreed to participate.
All selected participants were right-handed, females (average age = 40.8; age range 22-66). We obtained written informed consent and held a briefing during which we informed participants of the methodology, showed them the process, and showed them photographs of the fMRI machine in a presentation. Participants were screened for existing cerebral surgical procedures, eye problems, metal implants, or other conditions that could compromise the safety of the participants.
Tasks
We prepared 32 questions concerning experiences for each of the following content areas: "Luxury Retailer I," "Main Bank," and "Daily Life." The questions for Luxury Retailer I and Main Bank were identical except that the specified target was different.
We displayed questions on a small screen attached to a head coil. We instructed participants to answer by clicking one of two buttons (forced choice). A click with the thumb meant "yes" and click with the index finger meant "no." During the task, we told participants to strongly imagine their last experience at Luxury Retailer I and their main bank.
We exposed each participant to a task block followed by a rest block. Each task block lasted for 28 seconds, and the full session was composed of 12 blocks (four for each of the three tasks). Each task block contained eight questions for each of the three areas. The initial order of task blocks was pseudorandomized.
Data Acquisition
We obtained data as T2*-weighted gradient-echo (TR = 3931 ms) EPI MR images depicting BOLD-contrast, acquired using a 1.5T scanner (Symphony, Siemens) in 40 near-axial slices (FOV = 192 mm, 64 x 64 matrix, 3 mm thick) of each participant while they performed the assigned tasks. The resulting end slides obtained suggested there were no meaningful motion artifacts/edge susceptibility artifacts. The maximum differential value between n and n-1 scans for participant values was x = 0.11 mm, y = 0.46 mm, z = 0.50 mm, and the maximum rotation value was pitch = 0.01° angle, roll = 0.01° angle, yaw = 0.01° angle. Further, results of realignment show that periodic head movements did not affect the outcomes.
Data Analysis
Data were analyzed by SPM99 (Wellcome Department of Cognitive Neurology). All images were realigned and then normalized to the EPI template, and functional data were smoothed with a Gaussian kernel (FWHM = 9 x 9 x 9 mm) prior to statistical analysis.
RESULTS
Classification Differences and Participant Equivalence
To ensure that the three engagement groups actually differed in how engaged they were to Retailer I, we ran a one-way ANOVA on the three groups (highly engaged, moderately engaged, and disengaged). Results showed that the three groups differed significantly in CE11 scores ( F(2,13) = 43.16, p < .001), A8 scores ( F(2,13) = 20.07, p < .001), and Passion scores ( F(2,13) = 35.20, p < .001).
Additional analysis also revealed that the three engagement groups did not differ significantly in their engagement to their main bank on any of the engagement metrics (all Fs < = 1.05, all ps > .35). This confirms that engagement to Retailer I is independent of engagement to participants' main bank.
A one-way ANOVA confirmed the absence of meaningful age differences among the three groups highly engaged = 32.5 ( N = 4), moderately engaged = 38.1 ( N = 7), and disengaged = 51.2 ( N = 5) ( F(2,13) = 2.81, ns). But to provide additional assurance that there were no age effects on the engagement metrics for Retailer I, we ran an additional one-way ANCOVA on the three groups using age as a covariate. Results showed that age had no effect on engagement scores (all Fs < 1, all ps > .70) and that the three groups' scores remained significantly different when the effects of age were partialed out of the model, CE11 scores ( F(2,12) = 26.71, p < .001), A8 scores ( F(2,12) = 12.87, p < .001), and Passion scores ( F(2,12) = 22.98, p < .001).
Positive Click Rates and Reaction Times
Correlations between the positive ("yes") click rates for the Retailer I items and their corresponding CE11, A8, and Passion scores were all significant (CE11: r = .72; A8: r = .80; Passion: r =.68) strongly suggesting that participants' attitudes toward the retailer at the time of brain scanning matched their attitude measures captured six months earlier. We found a similar pattern for the Main Bank positive click rate. Correlations between the positive click rates for the Main Bank items and the corresponding Main Bank CE11, A8, and Passion scores were all significant (CE11: r = .60; A8: r = .72; Passion: r =.58). Positive click rates for Retailer I and Main Bank were uncorrelated (r = -.02) reinforcing the finding that engagement to Retailer I was independent of engagement to the bank.
Participants who were disengaged from Luxury Retailer I took longer to respond to the stimulus statements with a "yes" or "no" click (average RT = 2.04 s) than did participants who were more engaged emotionally (average RT = 1.89 s). The correlation between mean RT and CE11 scores was -0.32 and -0.44 for A8 scores. RTs for the daily life questions did not differ statistically among the three engagement groups.
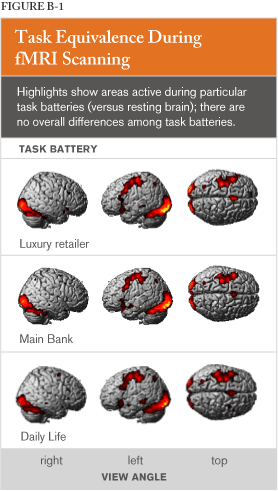
To ensure that participants' overall brain activity did not differ from task to task, brain activity during each task was adjusted to correct for resting activity by computing scores for each task battery minus rest (see Figure B-1). As you can see in the figure, the analysis yielded no significant differences in activity from task to task (all ps > .05).
 |
fMRI Results
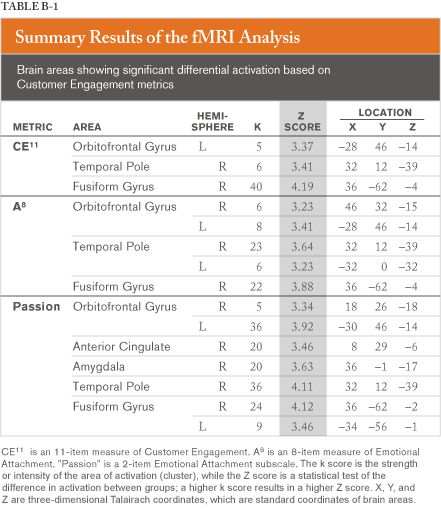
Summary brain activity results appear in Table B-1.
 |
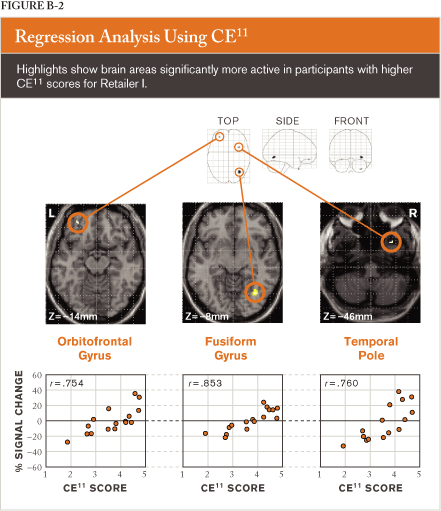
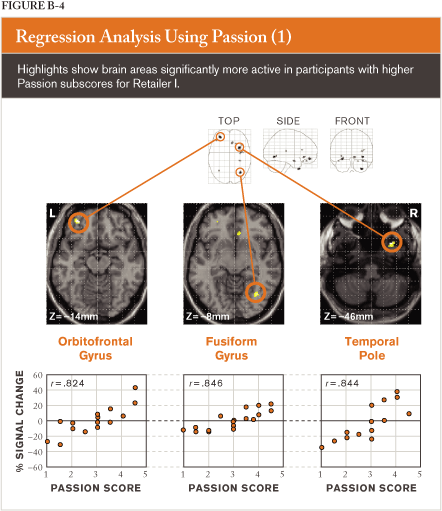
Regression analyses revealed that significant activation of the right fusiform gyrus, temporal pole, and orbitofrontal gyrus were all highly correlated with scores on the CE11, A8, and Passion metrics as shown in Figures B-2 through B-4. Figure B-2 is shown below.
 |
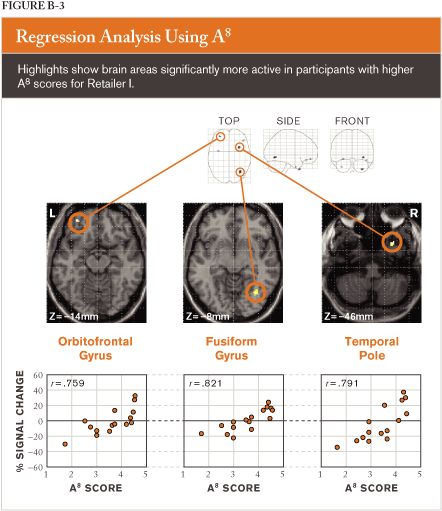
Regression analyses revealed that significant activation of the right fusiform gyrus, temporal pole, and orbitofrontal gyrus were all highly correlated with scores on the CE11, A8, and Passion metrics as shown in Figures B-2 through B-4. Figure B-3 is shown below.
 |
Regression analyses revealed that significant activation of the right fusiform gyrus, temporal pole, and orbitofrontal gyrus were all highly correlated with scores on the CE11, A8, and Passion metrics as shown in Figures B-2 through B-4. Figure B-4 is shown below.
 |
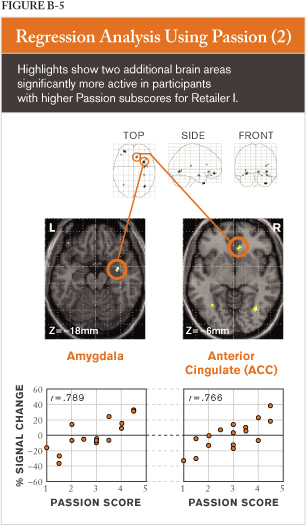
In addition, regression analyses revealed that significant activation of the anterior cingulate (ACC) and right amygdala were highly correlated with scores on the Passion metric as shown in Figure B-5.
 |
Business Outcome Results
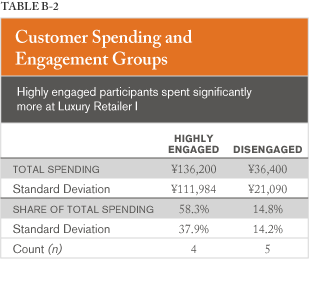
We asked participants about their yearly spending patterns at department stores and how much of that was spent at Luxury Retailer I. As shown in Table B-2, a two sample t-test revealed that highly engaged participants spent significantly more at Luxury Retailer I, in terms of total spending and the share of department store spending, than those who were disengaged ( t(7) = 1.98, p < .05 and t(7) = 2.40, p < .03, respectively).
 |
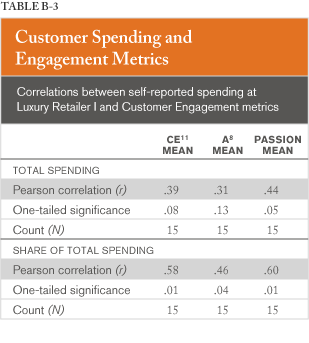
Further, there were strong and significant correlations between total spending at Luxury Retailer I and CE11, A8, and Passion scores, as shown in Table B-3.
 |
