GALLUP NEWS SERVICE
PRINCETON, NJ -- One of the established facts of political life today is the persistence of the so-called "gender gap," wherein men are more positive about Republican presidential candidates and Republican presidents, and women are more positive about Democrats.
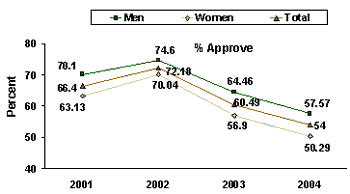
This is certainly evident in the job approval ratings given to President George W. Bush, who has consistently received higher job approval ratings from men than from women during his three years in office.
|
George W. Bush Job Approval, 2001-2004 |
||||
|
Total |
Men |
Women |
Gender Gap |
|
|
% |
% |
% |
% |
|
|
2004 |
54.0 |
57.57 |
50.29 |
7.28 |
|
2003 |
60.49 |
64.46 |
56.90 |
7.56 |
|
2002 |
72.18 |
74.6 |
70.04 |
4.56 |
|
2001 |
66.4 |
70.10 |
63.13 |
6.97 |
This gender gap (approval among men minus approval among women) has been relatively steady over the first three years of the Bush administration, ranging from a high of 7.56 percentage points in 2003 to a low of 4.56 in 2002, when Bush's overall rating was quite high. The data show that Bush began his administration with a high gender gap, which shrank after the terrorist attacks of 9/11 as his ratings rose to record levels. Over the last year, however, the gap has increased once again.
| George W. Bush’s Job Approval
Rating Yearly Average, by Gender |
 |
A poll-by-poll examination of the history of Bush's job approval shows that there have been only 3 polls out of the 124 Gallup has conducted in which Bush's approval rating among men was lower than his approval rating among women.
- June 12-15, 2003: 62% approval among men, 64% among women
- Jan. 10-12, 2003: 57% among men, 58% among women
- Aug. 19-21, 2002: 64% among men, 67% among women
On the other hand, the highest gender gap so far in the Bush administration came in August 2003, when 67% of men approved of the job Bush was doing, compared with just 52% among women.
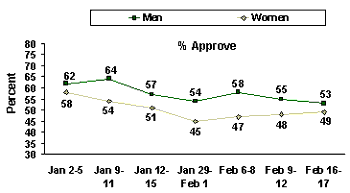
So far this year, Bush's job approval rating has averaged 57.57% among men and 50.29% among women, for an average gap of about 7.3 percentage points.
| George W. Bush’s Job Approval
Rating for 2004, by Gender |
 |
Elections
The gender gap has also been very apparent in Americans' voting patterns in all presidential elections since the 1980 election between Ronald Reagan and Jimmy Carter, but not consistently before that time. Gallup Polls show that men were slightly more likely than women to vote for Barry Goldwater than for Lyndon Johnson in 1964, for Richard Nixon than for Hubert Humphrey in 1968, and for Nixon than for George McGovern in 1972. However, men were actually more likely to vote for the Democratic candidate than were women in 1952, 1956, 1960, and 1976. More recently, as noted, a gender gap in which women skew toward the Democratic candidate has been present to one degree or the other in every election since 1980.
|
Vote for President, by Gender |
|||
|
Vote Among Men |
Vote Among Women |
Gender Gap (in pct. pts.) |
|
|
% |
% |
||
|
2000 |
|||
|
Democrat: Gore |
42 |
49 |
7 |
|
Republican: Bush |
51 |
43 |
-8 |
|
Percentage-point difference |
-9 |
6 |
15 |
|
1996 |
|||
|
Democrat: Clinton |
45 |
53 |
8 |
|
Republican: Dole |
44 |
38 |
-6 |
|
Percentage-point difference |
1 |
15 |
14 |
|
1992 |
|||
|
Democrat: Clinton |
41 |
46 |
5 |
|
Republican: Bush |
37 |
38 |
1 |
|
Percentage-point difference |
4 |
8 |
4 |
|
1988 |
|||
|
Democrat: Dukakis |
44 |
48 |
4 |
|
Republican: Bush |
56 |
52 |
-4 |
|
Percentage-point difference |
-12 |
-4 |
8 |
|
1984 |
|||
|
Democrat: Mondale |
36 |
45 |
9 |
|
Republican: Reagan |
64 |
55 |
-9 |
|
Percentage-point difference |
-28 |
-10 |
18 |
|
1980 |
|||
|
Democrat: Carter |
38 |
44 |
6 |
|
Republican: Reagan |
53 |
49 |
-4 |
|
Percentage-point difference |
-15 |
-5 |
10 |
|
1976 |
|||
|
Democrat: Carter |
53 |
48 |
-5 |
|
Republican: Ford |
45 |
51 |
6 |
|
Percentage-point difference |
8 |
-3 |
11 |
|
1972 |
|||
|
Democrat: McGovern |
37 |
38 |
1 |
|
Republican: Nixon |
63 |
62 |
-1 |
|
Percentage-point difference |
-26 |
-24 |
2 |
|
1968 |
|||
|
Democrat: Humphrey |
41 |
45 |
4 |
|
Republican: Nixon |
43 |
43 |
0 |
|
Percentage-point difference |
-2 |
2 |
4 |
|
1964 |
|||
|
Democrat: Johnson |
60 |
62 |
2 |
|
Republican: Goldwater |
40 |
38 |
-2 |
|
Percentage-point difference |
20 |
24 |
4 |
|
1960 |
|||
|
Democrat: Kennedy |
52 |
49 |
-3 |
|
Republican: Nixon |
48 |
51 |
3 |
|
Percentage-point difference |
4 |
-2 |
6 |
|
1956 |
|||
|
Democrat: Stevenson |
45 |
39 |
-6 |
|
Republican: Eisenhower |
55 |
61 |
6 |
|
Percentage-point difference |
-10 |
-22 |
12 |
|
1952 |
|||
|
Democrat: Stevenson |
47 |
42 |
-5 |
|
Republican: Eisenhower |
53 |
58 |
5 |
|
Percentage-point difference |
-6 |
-16 |
10 |
The gap reached its highest point in the 1984 election, when men voted for Reagan over Walter Mondale by a 28-point margin, compared to a slimmer 10-point margin for Reagan over Mondale among women.
The gap was almost as large in 2000, when Gallup's final poll showed men favoring Bush by a 9-point margin, with women favoring Al Gore by a 6-point margin. In 1996, men favored Bill Clinton over Bob Dole by just 1 point, while women favored Clinton by 15 points.
Gallup polling so far this year finds that the gender gap continues to appear in reference to projected voting in the 2004 election. While there has been some variation in the four polls conducted this year that have asked American voters to choose between George W. Bush and Democratic front-runner John Kerry, women's relatively higher preference for Kerry over Bush has been evident in each.
|
Presidential Election Polling |
||||||
|
Survey |
Candidate |
Total Sample |
Men |
Women |
Gender Gap (in pct. pts.) |
|
|
% |
% |
% |
||||
|
2004 Feb 16-17 |
LV |
John Kerry |
55 |
53 |
57 |
-4 |
|
George W. Bush |
43 |
44 |
42 |
2 |
||
|
Percentage-point gap |
9 |
15 |
||||
|
2004 Feb 6-8 |
LV |
John Kerry |
48 |
40 |
56 |
-16 |
|
George W. Bush |
49 |
58 |
39 |
19 |
||
|
Percentage-point gap |
-18 |
17 |
||||
|
2004 Jan 29-Feb 1 |
LV |
John Kerry |
53 |
47 |
58 |
-11 |
|
George W. Bush |
46 |
52 |
40 |
12 |
||
|
Percentage-point gap |
-5 |
18 |
||||
|
2004 Jan 9-11 |
LV |
John Kerry |
43 |
40 |
45 |
-5 |
|
George W. Bush |
55 |
59 |
52 |
7 |
||
|
Percentage-point gap |
-19 |
-7 |
||||
|
LV = Likely Voters |
||||||
The first two months of this year have been turbulent ones in general, with the overall "likely voter" preference changing from poll to poll. This is not unexpected in the highly volatile environment in which the Democratic primaries are being played out.
The gender gap among likely voters was most extreme in Gallup's Feb. 6-8 poll, in which Bush and Kerry were tied overall. But this parity was deceptive; there were huge differences by gender that essentially cancelled one another out. Bush led by 18 points among male likely voters, 58% to 40%, while trailing Kerry by a 56% to 39% margin among women.
The gender gap has moderated somewhat in Gallup's latest poll, conducted Feb. 16-17, in part because men became significantly more likely to vote for Kerry. But in each poll conducted this year, the gender differences are there, and are substantial.
It's interesting to note that over the last three Gallup Polls, there has been relatively little change in the voting patterns of women, whose preference for Kerry over Bush has been 18, 17, and 15 points respectively. Most of the variation has come among men, who have moved from a 5-point preference for Bush to an 18-point preference for Bush to a 9-point preference for Kerry.
Survey Methods
The latest survey results reported in this analysis are based on telephone interviews with a randomly selected national sample of 1,006 adults, aged 18 and older, conducted Feb. 16-17, 2004. For results based on this sample, one can say with 95%confidence that the maximum error attributable to sampling and other random effects is ±3 percentage points. In addition to sampling error, question wording and practical difficulties in conducting surveys can introduce error or bias into the findings of public opinion polls.
