Gallup first asked Americans whether they approved or disapproved of the job Congress was doing in 1974, and has continued asking it on an occasional or (beginning in 2001) a regular basis since then. An analysis of the trends on this measure over time shows that the last five years have brought historically high ratings of Congress. Prior to 1999, Congress never averaged above a 42% job approval rating for any calendar year. Since then, Congress has not averaged below a 42% job approval rating, although that record is being tested this year as the public grows more negative toward the direction of the country in general and President George W. Bush in particular with a sluggish economy and an ongoing war in Iraq.
Certainly, the overall spike in trust in government institutions following the Sept. 11 terrorist attacks benefited Congress, which had a record 84% job approval rating in October 2001. But even before then, Congress was rated more positively than had been the case previously, possibly because of the healthy economy and a relative absence of political scandal that reflected poorly on the institution.
Gallup data suggest that recent higher ratings of Congress may also reflect the optimism of youth. Specifically, one of the most persistent findings in Gallup polling is that younger Americans are much more likely than older Americans to approve of Congress. In the 126 times Gallup has measured congressional job approval since 1974, younger adults (those between the ages of 18 and 29) have been significantly more likely to express approval than older adults (those age 65 and older) 112 times.
The following table shows average congressional job approval ratings by age since Gallup first measured it in 1974 (including all data on congressional approval from the 126 polls). There is a clear inverse relationship between age and congressional approval, evidenced by the significant dropoff in approval ratings from each age group to the next.
Average Congressional Job Approval Ratings, Gallup Polls, 1974-2004
|
Overall |
41% |
|
|
|
|
18 to 29 years old |
49% |
|
30 to 49 years old |
43% |
|
50 to 64 years old |
37% |
|
65+ years old |
33% |
This phenomenon by which overall congressional approval drops by age also is apparent in ratings of both the Democrats and Republicans in Congress (which Gallup has measured 12 times since 1999), and to public trust in the national legislature (which Gallup has measured yearly since 1997). It thus appears that younger Americans are more likely to hold positive views than their elders are on a variety of attitudes toward Congress.
Average Ratings of Congress by Age, Gallup Polls
|
|
Approve of Democrats in Congress, 1999-2003 |
Approve of Republicans in Congress, 1999-2003 |
Percentage with Great Deal or Fair Amount of Trust in Congress, 1997-2003 |
|
|
|
|
|
|
Overall |
45% |
51% |
62% |
|
|
|
|
|
|
18 to 29 years old |
50% |
55% |
70% |
|
30 to 49 years old |
47% |
50% |
60% |
|
50 to 64 years old |
39% |
48% |
59% |
|
65+ years old |
39% |
47% |
65% |
While the age relationship also exists in ratings of national satisfaction and the economy, it is not as consistent nor as strong as it is for congressional approval. That is, while younger American adults are more likely than those who are older to give positive ratings to the course of the nation or the state of the nation's economy, these generational gaps are not as wide as they are for congressional job approval. Additionally, the gaps between age groups on these items do not appear as consistently from poll to poll as they do for congressional approval. And Gallup data show no consistent age differences in ratings of the last two presidents.
Average Approval Ratings of Presidents by Age, Gallup Polls
|
|
Approve of Bill Clinton, 1993-2001 |
Approve of George W. Bush, 2001-2004 |
|
|
|
|
|
Overall |
56% |
65% |
|
|
|
|
|
18 to 29 years old |
58% |
64% |
|
30 to 49 years old |
56% |
68% |
|
50 to 64 years old |
54% |
65% |
|
65+ years old |
55% |
60% |
Because the age gap in congressional approval ratings has persisted for 30 years, there is clearly something about being young that makes one more likely to approve of Congress. However, as people age, do their ratings of Congress grow significantly worse? Or do those who came of age in the 1970s and later continue to have relatively more positive views of Congress than those who came of age before them? The historical Gallup data on congressional approval allow for a test of these competing hypotheses.
To investigate these hypotheses, Gallup analyzed poll data taken at roughly 10-year intervals (October 1974, April-May 1983, February-March 1994 and January-April 2004). In each set of data, respondents were separated into birth cohorts, according to the decade of their birth. This allows for a test of how each birth cohort's approval ratings of Congress change over time, as well as a comparison of how the different birth cohorts' ratings look at different points in time.
Those born in the 1950s gave Congress an average approval rating of 44% in 1974, when respondents were 24 or younger; a 31% approval rating in 1983, when respondents were 24 to 33 years old; a 29% approval rating in 1994, when respondents were 35 to 44 years old; and a 41% approval rating in 2004, when respondents were 45 to 54 years old.
Approval Ratings of Congress at Approximately 10-Year Intervals by Decade of Birth
|
Year |
Overall |
1890s-1900s |
1910s |
1920s |
1930s |
1940s |
1950s |
1960s |
1970s |
1980s |
|
|
|
|
|
|
|
|
|
|
|
|
|
1974 |
35% |
24% |
23% |
29% |
34% |
39% |
44% |
N/A |
N/A |
N/A |
|
|
|
|
|
|
|
|
|
|
|
|
|
1983 |
33% |
28% |
25% |
35% |
36% |
32% |
31% |
41%* |
N/A |
N/A |
|
|
|
|
|
|
|
|
|
|
|
|
|
1994 |
29% |
N/A |
24%* |
26% |
21% |
24% |
29% |
32% |
42% |
N/A |
|
|
|
|
|
|
|
|
|
|
|
|
|
2004 |
43% |
N/A |
N/A |
34%* |
30% |
35% |
41% |
48% |
49% |
58% |
|
|
|
|
|
|
|
|
|
|
|
|
|
Average |
35% |
26% |
24% |
30% |
30% |
33% |
36% |
40% |
46% |
58% |
*For 1983 data, 1960 cohort includes 11 respondents born in 1970s
*For 1994 data, 1910 cohort includes 14 respondents born 1900-1909
*For 2004 data, 1920 cohort includes 4 respondents born 1900-1909 and 79 born 1910-1919
Later birth cohorts generally show more positive attitudes toward Congress across the four points in time, while earlier birth cohorts are less positive. Even when ratings of Congress overall were higher (as in 2004) or lower (1994), the later birth cohorts were more positive in their evaluations of Congress than earlier cohorts were. For example, those born in the 1960s gave Congress a low 32% job approval rating in 1994, but this was still higher than all other earlier birth cohorts. And as congressional approval ratings improved overall, the 1960s birth cohort still maintained significantly higher evaluations than all earlier birth cohorts.
Summarizing the data across the four polling periods further emphasizes the birth cohort differences. Those born in the 1930s or before averaged a 30% job approval rating or less across the four points in time, those born in the 1940s averaged a congressional job approval rating of between 30% and 40%, and those born in the 1960s or later averaged a 40% or higher job approval rating.
It's also clear that political conditions heavily influence ratings of Congress. For example, in 1994, all age groups had decidedly negative views of Congress, aside from those born in the 1970s. As such, there is not as much differentiation in congressional approval ratings as there was in 1974 or 2004. The 1994 data were measured a couple of years after the high point of congressional discontent that caused the term-limits movement to sweep through many states (though these have never been applied to members of Congress) and may have motivated the public to end the Democrats' 40-year run as the majority party in the U.S. House of Representatives.
A multivariate analysis, which allows for a simultaneous testing of a variety of variables' influence on congressional approval (the results of which are not reported here), confirms that age is an independent and strong predictor of whether a respondent approves of Congress, second only to presidential job approval. Other political factors, such as ratings of the national economy and satisfaction with the current course of the nation are also strong predictors, but not as influential as age. Thus, the analysis confirms that age is strongly related to one's views of Congress, but not exclusive of the influence of political factors.
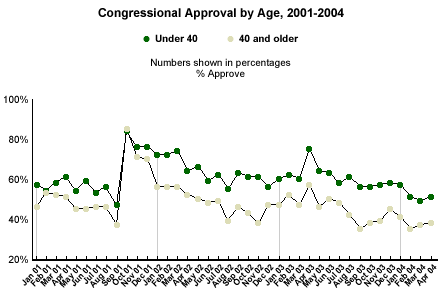
The cohort analysis presented above suggests that the 1960's birth cohort may be the turning point in congressional job approval. Since 2001, there has been a consistent double-digit gap in ratings of Congress by age, when comparing those under 40 with those 40 and older. The average gap between these two age groups has been 15 points, and the only time the groups reached parity was shortly after Sept. 11. The lines track each other quite faithfully -- probably in response to the prevailing political conditions -- but the distance between the groups remains.

The 1960's-1980's birth cohorts came of age well after the Watergate scandal caused a crisis of confidence in elected officials. Many of those who were born in these decades also had little direct experience with congressional scandals such as Abscam in the late 1970s and early 1980s, the "Keating Five" Savings & Loan scandal in late 1980s and early 1990s, and the check-bouncing scandal in the early 1990s. While many in these age groups did live through short-lived recessions in 1991 and 2001, most of them were not of voting age during the prolonged economic slumps of the 1970s and early 1980s. All of these factors may help explain why later birth cohorts tend to hold more positive views of Congress.
The findings presented here suggest that future ratings of Congress could be propped up by younger generations' more positive views of the national legislature, especially as older generations are replaced by new generations. This is not to minimize the effect political conditions will continue to have on congressional approval, as these clearly influence attitudes toward Congress. But younger generations may have built up a reservoir of goodwill toward the Congress that older generations have in much shorter supply. To the extent that members of Congress can avoid the scandals that brought shame on the institution, it should continue to be viewed in a much more positive light than has been the case historically.
