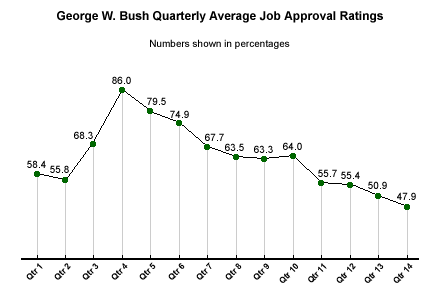
The most recent quarterly job approval average for George W. Bush was the worst of his presidency. Gallup polling data show that from April 20 to July 19, the 14th quarter of his presidency*, Bush averaged a 47.9% approval rating. That included his term-low individual rating of 46% in a May 7-9 CNN/USA Today/Gallup poll. Since that time, his approval rating has stabilized in the high 40s, within a narrow band of 47% to 49%.
Since peaking at a record-high level in the fourth quarter of his presidency (after the Sept. 11 terrorist attacks), Bush's quarterly average scores have maintained or declined, but have not improved from one quarter to the next. The 14th quarter marks the 10th consecutive quarter in which Bush's average approval rating has not improved. In those 10 quarters, Bush's average has shown significant decline six times, while holding steady the other four. The last time his approval average improved from one quarter to the next was in late 2001/early2002, when a 68% third-quarter average spiked to 86% in the fourth quarter. That 86% quarterly average is the highest Gallup has recorded for a president since 1950.

Bush's most recent quarter ranks only 163 out of 233 presidential quarters for which Gallup has data, dating back to the Truman administration. That puts it in just the 30th percentile of those presidential quarters.
Historical Comparison
Fourteenth-quarter approval ratings of full-term presidents have proven to be good barometers of a president's re-election prospects. Going back to the Dwight Eisenhower administration (excluding Lyndon Johnson and Gerald Ford who did not serve full first terms), each president with a 14th quarter approval rating above 50% was re-elected. The two who were below -- Jimmy Carter and the elder George Bush -- lost. But both those presidents had sub-40% approval averages in the 14th quarter of their one-and-only terms in office. Bush's 48% score as he seeks re-election puts him in uncharted territory, between the ratings of presidents who have won a second term in office, and those who have lost.
Presidential Approval Averages in 14th
Quarter of Presidency
(Full first-term presidents)
|
President |
Dates |
Average approval rating |
Number of cases |
|
|
|
% |
|
|
Eisenhower |
Apr 20-Jul 19, 1956 |
70.8 |
4 |
|
Nixon |
Apr 20-Jul 19, 1972 |
57.8 |
4 |
|
Carter |
Apr 20-Jul 19, 1980 |
35.8 |
6 |
|
Reagan |
Apr 20-Jul 19, 1984 |
53.9 |
7 |
|
G. H.W. Bush |
Apr 20-Jul 19, 1992 |
38.6 |
5 |
|
Clinton |
Apr 20-Jul 19, 1996 |
55.2 |
6 |
|
G. W. Bush |
Apr 20-Jul 19, 2004 |
47.9 |
7 |
At 63.6%, Bush's average approval rating for his term to date still rates as one of the best ever. Among presidents since the late 1940s, only John F. Kennedy (70%) and Eisenhower (65%) had higher term ratings than Bush's to date. Ironically, the next highest term average after Bush's is his father's 61% average job rating from 1989-1993.
The latest CNN/USA Today/Gallup poll, conducted July 19-21, shows Bush entering his 15th quarter in office with a 49% job approval rating. It's quite possible that the 46% rating marked the bottom for Bush, as his ratings have now stabilized if not shown a slight improvement since early May. While 49% may not be a sufficient level of approval to earn Bush re-election, there is no precedent for it. History suggests he will be in a stronger position if he and his advisers can move the needle above the 50% mark.
*Bush's quarterly average is taken from the results of seven Gallup Polls conducted between April 20 and July 19, 2004. Each poll consisted of interviews with approximately 1,000 randomly selected national adults, each with a margin of error of ±3 percentage points.
