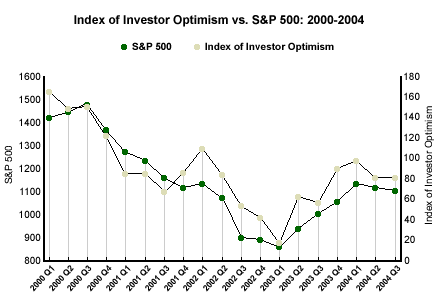
New UBS/Gallup Index of Investor Optimism* figures reveal that monthly optimism scores are at a four-month low, which in turn kept the overall average score for the third quarter at 80, unchanged from the second-quarter average.
What implication does the third-quarter average have for the presidential election? The good news for President George W. Bush is that investor optimism didn't continue the slide it took between the first and second quarters. Although the third-quarter figure remained steady, it doesn't offer much to go on in terms of broad momentum heading into November.
It's been said that the market tends to perform well in election years, particularly in the second half as the election approaches. This tendency proved true in the 1980s and 1990s. In 1996, the market enjoyed a strong year, topping out in November, which worked out well for presidential incumbent Bill Clinton. The market peaked at the end of 1992, though just a little too late for that incumbent, George H.W. Bush. Bush had better luck in 1988, when the market hit its apex in October, just a few weeks before the election. In 1984, after a slump in the early months of the year, the market recovered nicely to help Ronald Reagan secure a landslide victory.
But in 2000, the market numbers ran somewhat contrary to the election year climbing trend. That year, the market peaked in the third quarter before sliding in the last quarter of the year. However, the slide could have been related to the uncertainty of the election outcome that fall. Again, there have been predictions that the market will do well in 2004, but after a strong showing early in the year, it has been stagnant over the past two quarters.
The UBS/Gallup Index of Investor Optimism generally tracks the direction of the stock market. But in 2000, optimism peaked in the first quarter before settling down to where the market was in the second quarter. After surging in 2003, so far in 2004, the quarterly optimism average declined between the first and second quarters and remained flat in the third quarter.

The Index of Investor Optimism and the S&P 500 seem to be correlated. And there's no question that both presidential candidates are keenly interested in the outlook of U.S. investors, since 97% of investors say they plan to vote in the election (see "Why Are So Many Investors Uncommitted in Presidential Election?" in Related Items).
Bottom Line
The lack of movement in the market this quarter could be setting the stage for either a timely surge in both the stock market and in investor optimism, which would benefit incumbents, or a repeat of the economic bad news that occurred around the time of the last presidential election.
The way the market performs in October could have a lot to do with how much confidence investors have in the market and in their government. The recent rate hike by the Fed and lawsuits against Fannie Mae may forebode a weak month for the market; then again, they may be the last obstacles to a strong market finish in 2004. Regardless, investors and political candidates alike will be watching the market closely over the next five weeks.
*Results are based on telephone interviews with 2,400+ investors, aged 18 and older, conducted quarterly between January 2000 and September 2004. For results based on the entire sample, one can say with 95% confidence that the margin of sampling error is ±2 percentage points.

