GALLUP NEWS SERVICE
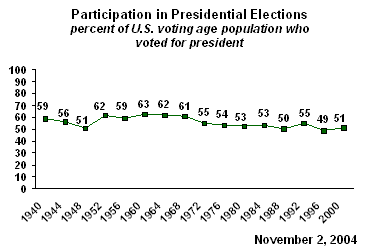
PRINCETON, NJ -- Generally speaking, high interest in an election is usually associated with higher levels of voter turnout. This year, Gallup has measured dramatically higher levels of interest than in any recent presidential election year. Additionally, a much greater proportion of Americans are qualifying as likely voters than in previous election years. A comparison of Gallup historical data from recent elections suggests that turnout this year may well achieve levels not seen since the 1968 presidential election.
Historical Voter Turnout
In 1971, the 26th Amendment to the U.S. Constitution was passed, which lowered the minimum voting age to 18. Since that time, voter turnout has only been as high as 55% of the voting age population (in 1972 and 1992), after routinely being around 60%. Typically, turnout has been closer to 50% in recent elections.

Turnout in 2004
Even early in the year, Gallup began measuring much higher levels of attention to the campaign than in previous years, as well as higher levels of stated enthusiasm about voting. Comparisons of Gallup's key election interest indicators make it clear that turnout should exceed any recent election.
Voter Registration
The news media have written many stories about the increase in voter registration this year. Gallup's data confirm that a significantly higher proportion of U.S. adults are registered to vote this year than in the past. According to Gallup's final pre-election poll, conducted Oct. 29-31, 90% of national adults tell us they are now registered to vote or plan to register by Tuesday. That's eight to nine points higher than in each of the last three elections.
|
1992 |
1996 |
2000 |
2004 |
|
|
Registered/Plan to register |
82% |
81 |
81 |
90 |
Thought Given to the Election
One of Gallup's likely voter questions measures the amount of thought Americans are giving to the presidential election. Gallup analyses find that this measure correlates with voter turnout levels. In the final CNN/USA Today/Gallup pre-election poll, 84% of Americans say they are giving "quite a lot" of thought to the election. This is 16 to 18 percentage points higher than in the two most recent elections.
|
1992 |
1996 |
2000 |
2004 |
|
|
Quite a lot |
N/A |
66% |
68 |
84 |
Ten-point Likelihood to Vote Scale
A second Gallup likely voter question asks Americans to indicate how likely they are to vote on a 10-point scale, with 10 representing "someone who definitely will vote," and 1 representing "someone who definitely will not vote." The percentage of Americans giving themselves a 10 on this scale this year, 82%, is significantly higher than in 2000.
|
Rating on scale |
1992 |
1996 |
2000 |
2004 |
|
% |
% |
% |
% |
|
|
10 |
N/A |
N/A |
68 |
82 |
|
9 |
N/A |
N/A |
5 |
3 |
|
8 |
N/A |
N/A |
5 |
3 |
|
7 |
N/A |
N/A |
2 |
1 |
Certainty to Vote
In prior final pre-election polls, Gallup has asked Americans who indicated that they would vote how certain they are to vote. This was often used as a measure to help predict what turnout would be on Election Day. The question was not asked in this year's final poll, but was asked in the semi-final pre-election poll of Oct. 22-24. In that poll, 86% of Americans said they are absolutely certain to vote. This compares with 70% in the final pre-election poll in 2000 and 68% in the final 1996 poll.
|
How Certain to Vote |
1992 |
1996 |
2000 |
2004 |
|
Absolutely |
65% |
68 |
70 |
86 |
Likely Voter Scores
Gallup asks seven questions (including a couple mentioned above) to determine how likely people are to vote. Responses to these questions are used to create a scale ranging from zero to seven that represents a respondent's likelihood of voting. Usually, those who score a "6" or "7" on the scale are included in Gallup's likely voter model. This year, 56% of respondents in the final pre-election poll achieved the highest score on the likely voter scale, a 20% increase over any of the three most recent elections. The 72% who score a 6 or 7 is at least 15% higher than in the three most recent elections.
|
Likely Voter Score |
1992 |
1996 |
2000 |
2004 |
|
% |
% |
% |
% |
|
|
7 |
46 |
41 |
44 |
56 |
|
6 |
16 |
18 |
17 |
16 |
|
5 |
9 |
10 |
10 |
8 |
|
0-4 |
29 |
31 |
29 |
20 |
Gallup typically assumes 50% turnout in its likely voter model as a starting point, and adjusts that as the interest indicators change. After increasing its turnout assumption to 55% in late July, around the time of the Democratic convention, Gallup increased it again to 60% in the Oct. 22-24 poll.
Clearly, then, the data indicate that voter turnout should exceed anything in recent U.S. history. The question that will be answered today is just how much higher turnout will be.
Survey Methods
These results are based on telephone interviews with a randomly selected national sample of 2,014 adults, aged 18 years and older, conducted Oct. 29-31. For results based on this sample, one can say with 95% confidence that the maximum error attributable to sampling and other random effects is ±2 percentage points. In addition to sampling error, question wording and practical difficulties in conducting surveys can introduce error or bias into the findings of public opinion polls.
