GALLUP NEWS SERVICE
PRINCETON, NJ -- As many Americans scramble to finish their federal income tax returns by April 15, a new Gallup economic poll finds that Americans are now just as likely to say they will file their tax returns by mail as they are to file them electronically, with younger Americans much more likely to do so than older Americans. This is the highest proportion of Americans saying they plan to file their returns electronically since Gallup first asked the question eight years ago.
A recent Experian/Gallup Personal Credit Index survey also shows that most Americans expect to receive a tax refund this year, and that they will use their refunds mostly to pay off bills and debt. Over half of Americans who owe money to the government say they will pay the Internal Revenue Service (IRS) the entire amount without borrowing money, while about one in four plan to borrow money to pay their taxes in full, or plan to participate in an IRS installment payment plan.
Americans Split About Filing Tax Returns by Mail or Electronically
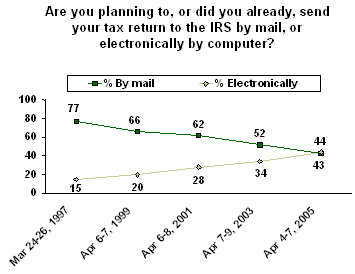
The Gallup poll on economy and finance, conducted Apr. 4-7, finds that Americans are equally likely to say they will file their tax return by mail (43%) as they are to file electronically (44%). In all previous years when this question was asked, more people indicated they would file by regular mail than electronically.
In 1997, when this question was first asked, more than three in four Americans said they planned to file their tax returns by mail, and only one in six said electronically. Since that time, there has been a gradual increase in electronic filing. By 2003, only a slim majority of Americans, 52%, said they planned to file by mail, while one-third (34%) said they would file their returns electronically.

Over the years, electronic filing as gained popularity among people in all age groups, but this is the first year when Americans under age 50 are more likely to file their taxes electronically than to file them by mail.
|
Are you planning to, or did you already, send your tax return to the IRS by mail, or electronically by computer? |
||||||
|
Ages 18 to 29 |
Ages 30 to 49 |
50 years and older |
||||
|
|
Electronically |
|
Electronically |
|
Electronically |
|
|
% |
% |
% |
% |
% |
% |
|
|
2005 Apr 4-7 |
35 |
57 |
38 |
55 |
50 |
30 |
|
2003 Apr 7-9 |
42 |
43 |
51 |
40 |
59 |
23 |
|
2001 Apr 6-8 |
53 |
43 |
59 |
34 |
69 |
13 |
|
1999 Apr 6-7 |
64 |
26 |
66 |
25 |
69 |
11 |
|
1997 Mar 24-26 |
73 |
26 |
78 |
17 |
76 |
8 |
As the table illustrates, the rate of increased electronic submissions is highest among 30- to 49-year-olds, with the rate increasing from 17% in 1997 to 55% now -- an increase of 38 percentage points. By comparison, 18- to 29-year-olds show an increase in electronic filing of 31 percentage points (from 26% in 1997 to 57% earlier this month), and the oldest group shows an increase of 22 percentage points (from 8% to 30%).
More than 6 in 10 Americans Expect to Receive a Tax Refund
More than 8 in 10 Americans (85%) say they will file their taxes by the April 15 deadline, while only 7% say they expect to take an extension. This is according to the latest Experian/Gallup Personal Credit Index survey, conducted Mar. 14-20, which asked Americans several questions about this year's federal income taxes.
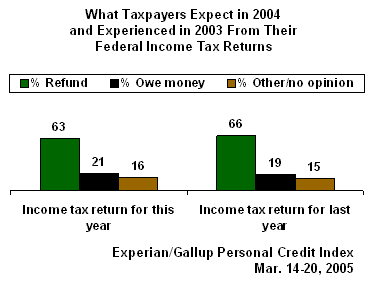
More than 6 in 10 Americans say they have received or expect to receive a tax refund, while 21% say they owe or expect to owe this year. When asked about last year's income taxes, two in three Americans said they received a refund, while 19% said they owed money.

Americans who owe the federal government money on this year's tax return say they owe an average of $2,205. This includes 30% of Americans who owe less than $1,000, 22% who owe between $1,000 and $5,000, and 10% who owe $5,000 or more. About one-third say they do not know how much they owe.
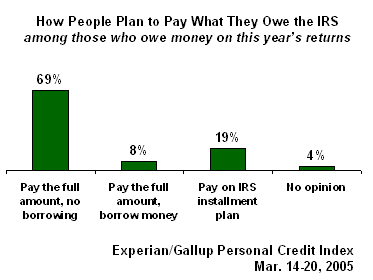
Nearly 7 in 10 respondents who owe the government money this year say they will pay the entire amount without borrowing money to do so, while 8% say they will pay the whole amount but will need to borrow money. Roughly one in five Americans say they are paying the money on an IRS installment plan.

The average expected refund this year is $2,065. This includes refunds from 25% who expect to receive less than $1,000, 14% who expect between $1,000 and $2,000, 22% who expect between $2,000 and $5,000, and 8% who say they will get back $5,000 or more. One in five Americans say they do not know how much of a refund they will receive this year.
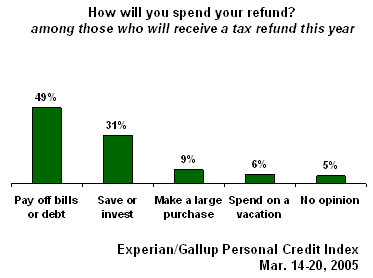
Among those receiving a refund this year, nearly half (49%) say they will use the money to pay off bills or debt, while 31% will invest or save it, 9% will make a large purchase, and 6% will spend it on a vacation.

Survey Methods for the Gallup Poll on Economy and Finance
These results are based on telephone interviews with a randomly selected national sample of 1,010 adults, aged 18 and older, conducted April 4-7, 2005. For results based on this sample, one can say with 95% confidence that the maximum error attributable to sampling and other random effects is ±3 percentage points. In addition to sampling error, question wording and practical difficulties in conducting surveys can introduce error or bias into the findings of public opinion polls.
38. Do you believe it is becoming -- [ROTATED: easier for someone to cheat on their income taxes, has there been no change, or is it becoming harder for someone to cheat on their income taxes]?
|
Easier |
No change |
Harder |
No opinion |
|
|
2005 Apr 4-7 |
21% |
35 |
30 |
14 |
39. Are you planning to, or did you already, send your tax return to the IRS by mail, or electronically by computer?
|
|
|
|
Doesn't apply/ |
|
|
|
% |
% |
% |
% |
% |
|
|
2005 Apr 4-7 |
43 |
44 |
10 |
2 |
1 |
|
2003 Apr 7-9 |
52 |
34 |
3 |
11 |
* |
|
2001 Apr 6-8 |
62 |
28 |
2 |
7 |
1 |
|
1999 Apr 6-7 |
66 |
20 |
4 |
9 |
1 |
|
1997 Mar 24-26 |
77 |
15 |
2 |
6 |
* |
Survey Methods for the Experian/Gallup Personal Credit Index
Results for the Experian/Gallup Personal Credit Index are based on telephone interviews with 1,010 national adults, aged 18 and older, conducted March 14-20, 2005. For results based on this sample, one can say with 95% confidence that the maximum margin of sampling error is ±3 percentage points. In addition to sampling error, question wording and practical difficulties in conducting surveys can introduce error or bias into the findings of public opinion polls.
23. Have you already filed, or do you expect to file, your 2004 tax returns by the April 15 deadline, or do you expect to take an extension?
|
Will have filed |
Get an |
Other |
Don't know/ |
|
|
2005 Apr |
85% |
7 |
7 |
1 |
24. Which statement best represents your tax burden for 2004 -- 1) you have received or expect to receive a tax refund, or 2) you owe, or expect to owe, a tax payment?
|
Receive |
Owe tax |
Other |
Don't know/ |
|
|
2005 Apr |
63% |
21 |
11 |
5 |
25. And when you filed your income tax form last year for 2003, 1) did you receive a tax refund, or 2) did you owe money?
|
Received tax |
Owed |
Got it |
Don't know/ |
|
|
2005 Apr |
66% |
19 |
6 |
9 |
26. How much is the refund for, or how much do you expect it to be for, this year? [Based on those who will receive a refund; n = 633; margin of error = +/- 4 pct. pts.]
|
Less than $1,000 |
$1,000 to less than $2,000 |
$2,000 to less than $5,000 |
$5,000 or more |
Don't know |
|
|
|
|
|
2005 Apr |
25% |
14 |
22 |
8 |
20 |
11 |
$2,065 |
$1,400 |
27. How much did you owe, or expect to owe, on your tax return this year? [Based on those who will owe taxes this year; n = 222; margin of error = +/- 7 pct. pts.]
|
Less than $1,000 |
$1,000 to less than $5,000 |
|
|
|
|
|
|
|
2005 Apr |
30% |
22 |
10 |
32 |
6 |
$2,205 |
$1,000 |
28. Did you pay, or plan to pay, the whole amount to the IRS, or are you paying the money on the IRS installment plan? [Based on those who will owe taxes this year; n = 222; margin of error = +/- 7 pct. pts.]
|
Paid (or will pay) |
Paying on |
Don't know/ |
|
|
2005 Apr |
77% |
19 |
4 |
29. Were you aware that the IRS has an installment plan, or not? [Based on those who will owe taxes this year and will pay whole amount; n = 188; margin of error = +/- 8 pct. pts.]
|
Yes |
No |
Don't know/ |
|
|
2005 Apr |
56% |
40 |
4 |
30. To pay the money to the IRS, did you have to borrow money, or will you have to borrow money -- either on a credit card or bank loan, or a home equity loan or home equity account, or from family or friends -- or do you have enough money to cover the payment without borrowing? [Based on those who will owe taxes this year and will pay whole amount; n = 182; margin of error = +/- 8 pct. pts.]
|
Borrowed/ |
Have enough |
Other |
|
|
|
2005 Apr |
10% |
89 |
1 |
* |
[Based on those who will owe taxes this year; n = 222; margin of error = +/- 7 pct. pts.]
|
Paid (or will pay) |
Paid (or will pay) |
|
|
|
|
2005 Apr |
69% |
8 |
19 |
4 |
34. How will you spend your refund? Will you use it mostly to 1) pay off bills or debt, 2) invest or save, 3) make a large purchase, such as a car or furniture, or 4) spend on a vacation? [Based on those who will receive a refund; n = 633; margin of error = +/- 4 pct. pts.]
|
|
|
Make a large purchase |
|
Don't know/ refused |
|
|
2005 Apr |
49% |
31 |
9 |
6 |
5 |

