GALLUP NEWS SERVICE
PRINCETON, NJ -- The news for President George W. Bush on Social Security is not good. His approval ratings on Social Security are the worst they have been all year, and more Americans have faith in the Democrats than in the Republicans to deal with the issue. A majority of Americans continue to oppose private investment accounts -- Bush's core idea for addressing the Social Security system. And while a majority of Americans acknowledge Bush has proposed a Social Security plan, fewer describe it as a clear plan.
Decidedly Weak Approval on Social Security
According to the June 24-26, 2005, CNN/USA Today/Gallup poll, only 31% of Americans approve of Bush's handling of Social Security; 64% disapprove. That amounts to a -33 net approval rating on Social Security, which is lower than where he stood even a month ago, and is substantially lower than results from earlier in the year.
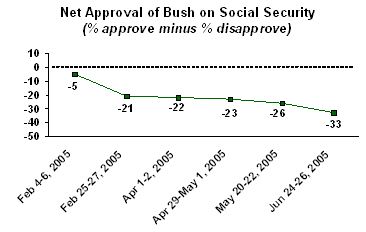
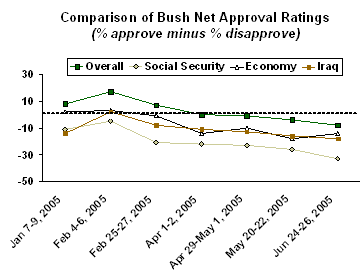
Bush's declining ratings on Social Security are possibly part of a larger pattern that is not directly related to his specific performance on the issue. His dwindling support on Social Security parallels a decline in his overall job approval rating, and is similar to the trend seen for his handling of the economy and Iraq.
No to Private Investment Accounts
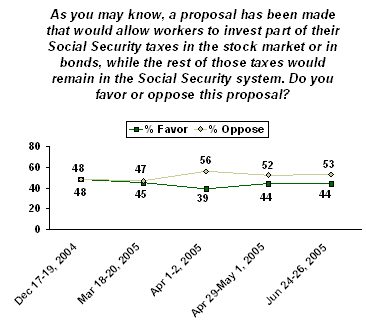
Still, the important fact remains that a majority of Americans seem resistant to Bush's idea of establishing private investment accounts within the Social Security system -- at least as Gallup describes that idea. Fifty-three percent of Americans say they oppose a proposal that would "allow workers to invest part of their Social Security taxes in the stock market or in bonds, while the rest of those taxes would remain in the Social Security system." Just 44% favor this. These results are nearly identical to those measured in late April.
Party affiliation presents the biggest distinctions in support for private accounts. About two-thirds of Republicans (69%) favor the idea, while three-quarters of Democrats (74%) and a majority of independents (59%) oppose it.
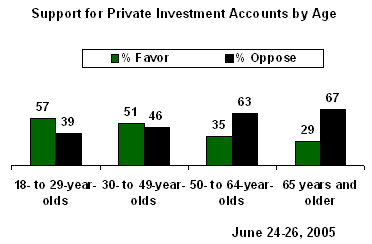
But the differences are almost as stark according to the age of respondents. Adults under age 50 generally favor the idea while those 50 and older oppose it.
Not Even an "A" for Effort
Bush gets moderate credit from Americans for having proposed a plan for addressing the Social Security system. Two-thirds (67%) acknowledge he has a plan, compared with less than half (47%) who say the same of the Democrats in Congress. However, only a quarter of Americans believe Bush has proposed a clear plan, leaving a great deal of room for improvement on this front.
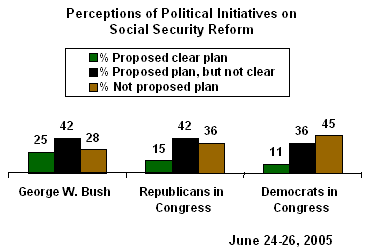
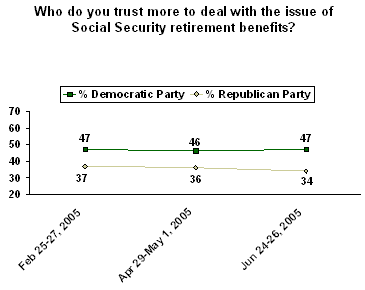
Republicans might hope that Bush's Social Security initiative leaves Democrats vulnerable to being seen as obstructing the issue -- opposing Bush's plan without having one of their own. However, Americans still choose the Democrats over the Republicans as the party they trust more to deal with Social Security retirement benefits.
Survey Methods
These results are based on telephone interviews with a randomly selected national sample of 1,009 adults, aged 18 and older, conducted June 24-26, 2005. For results based on this sample, one can say with 95% confidence that the maximum error attributable to sampling and other random effects is ±3 percentage points. In addition to sampling error, question wording and practical difficulties in conducting surveys can introduce error or bias into the findings of public opinion polls.
2. Do you approve or disapprove of the way George W. Bush is handling -- [RANDOM ORDER]?
|
2005 Jun 24-26 |
|
|
|
% |
% |
|
|
Terrorism |
55 |
41 |
|
The economy |
41 |
55 |
|
The situation in Iraq |
40 |
58 |
|
Energy policy |
36 |
53 |
|
Healthcare policy |
34 |
59 |
|
Social Security |
31 |
64 |
C. Social Security
|
Approve |
Disapprove |
No opinion |
|
|
% |
% |
% |
|
|
2005 Jun 24-26 |
31 |
64 |
5 |
|
|
|
|
|
|
2005 May 20-22 ^ |
33 |
59 |
8 |
|
2005 Apr 29-May 1 |
35 |
58 |
7 |
|
2005 Apr 1-2 |
35 |
57 |
8 |
|
2005 Feb 25-27 |
35 |
56 |
9 |
|
2005 Feb 4-6 |
43 |
48 |
9 |
|
2005 Jan 7-9 |
41 |
52 |
7 |
|
2002 Mar 22-24 ^ |
47 |
40 |
13 |
|
2001 Jul 10-11 |
49 |
35 |
16 |
|
2001 Mar 9-11 |
49 |
31 |
20 |
|
^ Asked of half sample |
|||
13. As you may know, a proposal has been made that would allow workers to invest part of their Social Security taxes in the stock market or in bonds, while the rest of those taxes would remain in the Social Security system. Do you favor or oppose this proposal?
|
|
Favor |
Oppose |
No opinion |
|
% |
% |
% |
|
|
2005 Jun 24-26 |
44 |
53 |
3 |
|
|
|
|
|
|
2005 Apr 29-May 1 |
44 |
52 |
4 |
|
2005 Apr 1-2 ^ |
39 |
56 |
5 |
|
2005 Mar 18-20 ^ |
45 |
47 |
8 |
|
2004 Dec 17-19 ^ |
48 |
48 |
4 |
|
^ Asked of half sample |
|||
14. Who do you trust more to deal with the issue of Social Security retirement benefits -- [ROTATED: the Democratic Party (or) the Republican Party]?
|
|
|
BOTH EQUALLY (vol.) |
|
|
|
|
% |
% |
% |
% |
% |
|
|
2005 Jun 24-26 |
47 |
34 |
3 |
13 |
3 |
|
|
|
|
|
|
|
|
2005 Apr 29-May 1 |
46 |
36 |
3 |
12 |
3 |
|
2005 Feb 25-27 |
47 |
37 |
2 |
9 |
5 |
15. Do you think -- [ROTATED: George W. Bush/the Democrats in Congress/the Republicans in Congress] -- has/have proposed a clear plan for addressing the Social Security system, has/have proposed a plan, but one that is not clear to you, or has/have not proposed a specific plan for addressing the Social Security system?
|
|
|
Proposed |
Have not proposed specific plan |
|
|
% |
% |
% |
% |
|
|
George W. Bush |
25 |
42 |
28 |
5 |
|
The Republicans in Congress |
15 |
42 |
36 |
7 |
|
The Democrats in Congress |
11 |
36 |
45 |
8 |