

American Public Opinion About Congress
Tuesday, August 02, 2005
by Joseph Carroll
Congressional Job Approval
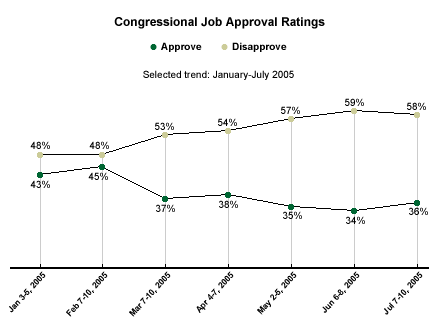
A recent Gallup Poll, conducted July 7-10, finds that only 36% of Americans approve of the way Congress is handling its job, while the majority of Americans, 58%, disapprove. Congressional approval ratings were higher at the beginning of the year, when more than 4 in 10 Americans (43% in January, 45% in February) approved. In March, ratings declined to the mid-30% range, where they have remained.
Ratings of Congress were significantly higher in the first years of the Bush administration than Gallup has found more recently. Congressional job approval averaged 56% in 2001. Ratings then began to drop each year, to an average of 54% in 2002, 47% in 2003, and 42% in 2004. So far this year, approval of Congress has averaged 38%. The last time Gallup found ratings in the current 30% range over a number of months was during the first half of 1997.
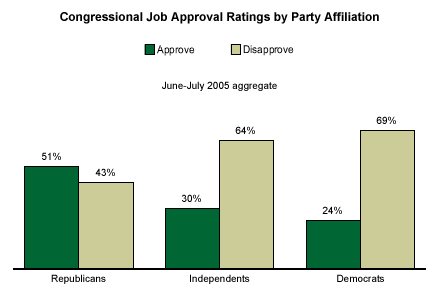
An analysis of Gallup Polls from June and July of this year shows that congressional job approval ratings differ significantly by party affiliation, political ideology, and age.
- The results show that a slim majority of Republicans, 51%, approve of the way Congress is handling its job. This compares with 30% of independents and only about a quarter of Democrats (24%). This is not surprising, given that both houses of Congress are now controlled by the Republicans.
- Forty-four percent of self-identified conservatives approve of Congress. This sentiment is much lower among moderates (32% approve) and liberals (23%).
- The June-July aggregate also finds that younger adults are much more likely to approve of Congress than are older Americans. Nearly half of adults aged 18 to 29 approve of Congress, while 38% of 30- to 49-year-olds and 26% of those aged 50 and older share this view.
The aggregate finds only modest variation in ratings of Congress by gender, education, income, and race.
Views of the Political Parties
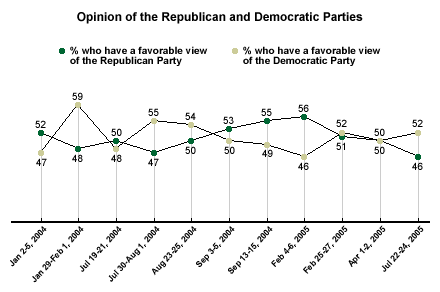
A recent CNN/USA Today/Gallup poll, conducted July 22-24, asked Americans to give their opinions of the two major political parties. The results show that Americans are slightly more likely to say they have a favorable opinion of the Democratic Party than they are to say this about the Republican Party. A slight majority of respondents, 52%, view the Democratic Party favorably, while 46% view the Republican Party favorably.
These results have shown some significant fluctuation this year. In early February, by a 56% to 46% margin, Americans were more likely to view the Republican Party favorably, rather than the Democratic Party. In late February and again in April, there were essentially no differences in views of the two parties. Now, as noted, Americans have become slightly more likely to view the Democratic Party favorably.