GALLUP NEWS SERVICE
PRINCETON, NJ -- Former smoker and ABC News anchor Peter Jennings' recent death from lung cancer has done a lot to remind people about the health dangers associated with smoking. Gallup polling shows that Americans overwhelmingly acknowledge the dangers of smoking, though smokers are somewhat less likely to do so. Over time, the number of smokers in the U.S. adult population has dropped, as has the reported daily number of cigarettes that smokers smoke. Most of the roughly one-quarter of Americans who smoke would like to quit, but most also feel they are addicted to cigarettes. Heavy smokers are much more likely than light smokers to feel they are addicted, but not more likely to express a desire to quit.
Smoking Incidence
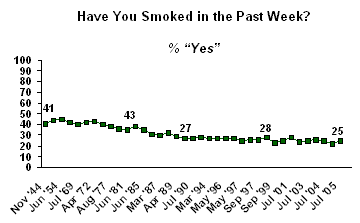
Gallup's annual Consumption Habits poll, conducted July 7-10 this year, tracks Americans' smoking habits and their attitudes toward smoking. About one in four Americans say they smoke cigarettes; this proportion has changed little since the mid-1990s. However, it has decreased substantially from when Gallup began asking about it in the 1940s. A 1944 Gallup Poll found 41% of Americans saying they smoked cigarettes in the past week. The highest percentage of reported smoking that Gallup recorded was 45% in 1954.
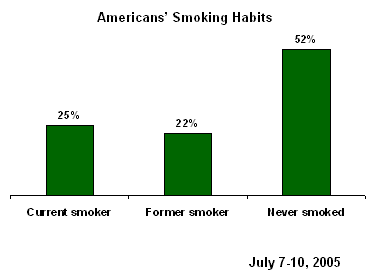
Thirty percent of nonsmokers say they have smoked cigarettes on a regular basis at some point in their lives, meaning nearly half of the adult population has regularly smoked cigarettes.
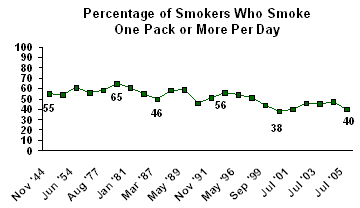
One silver lining in the smoking data is that those who smoke today report smoking fewer cigarettes each day on average than did smokers of the past. The July 2005 poll finds a majority of smokers saying they smoke less than one pack per day, which has been the case since 1999. The current data show 4 in 10 smokers indicating they smoke a pack or more per day, while polling in the late 1970s and early 1980s found about 6 in 10 smokers saying they smoked a pack or more a day.
Risks With Smoking
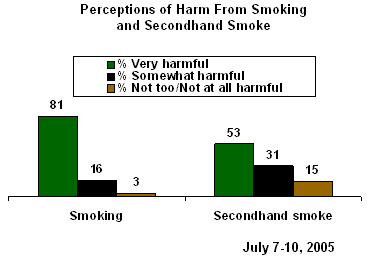
Even before Jennings' death, Americans were well aware of the harm smoking could do to their health. Eight in 10 Americans believe smoking is very harmful to smokers. Fifty-three percent say secondhand smoke is very harmful to adults. Both results have been quite consistent over the past four years.
Americans, too, are well aware of the link between smoking and lung cancer. In 2001, 71% of Americans said smoking was "a major cause of lung cancer," 11% said it was a minor cause, and just 16% said science hadn't been able to establish a link between the two.
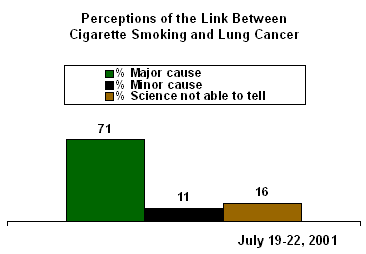
As a group, smokers clearly recognize the risks inherent in their habit, but are perhaps less willing to admit it. The 2001 poll showed that 77% of nonsmokers -- but only 57% of smokers -- believed that smoking is a major cause of lung cancer. In the July 2005 poll, 86% of nonsmokers say smoking is very harmful to those who smoke, compared with just 65% of smokers.
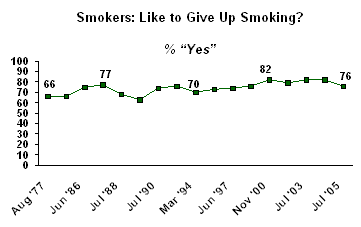
Still, the vast majority of smokers would like to quit. The recent Consumption Habits poll finds 76% of smokers saying they would like to give up smoking. This percentage has ranged between 76% and 82% since 1999. Gallup has always found at least a majority of smokers expressing a desire to quit, dating back to the initial asking in 1977.
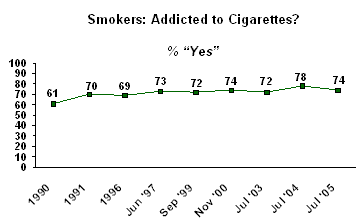
In 1990, Gallup found 61% of smokers saying they considered themselves addicted to cigarettes. That percentage has increased over time -- currently, 74% say they are addicted, and at least 7 in 10 have said so since 1997.
A Closer Look at Smokers
Because Gallup has asked the smoking questions consistently over the years, the poll results can be combined to look at a larger sample of smokers. The following analyses are based on smokers' answers to poll questions from 2000 to 2005.
Smokers can be classified into one of four groups, according to whether or not they consider themselves addicted to cigarettes and whether or not they want to give up smoking. A majority of smokers consider themselves addicted to cigarettes and would also like to give up smoking. Another 17% do not consider themselves addicted but still would like to quit. Eleven percent consider themselves addicted but do not want to give up smoking.
Smoker Typology, 2000-2005 Gallup Poll Data
|
Addicted and want to give up smoking |
63% |
|
Addicted, do not want to give up smoking |
11 |
|
Not addicted, want to give up smoking |
17 |
|
Not addicted, do not want to give up smoking |
7 |
The desire to quit is more prevalent among smokers who believe they have an addiction. Eighty-five percent of smokers who consider themselves addicted would like to give up smoking, compared with 69% of those who do not consider themselves addicted.
Heavy smokers -- those who smoke more than one pack per day -- are more likely to believe they are addicted to cigarettes, but not more likely to want to quit. Ninety-three percent of smokers who smoke more than a pack per day believe they are addicted to cigarettes (as do 90% of those who smoke between a half pack and a full pack daily). In contrast, only 60% of those who smoke half a pack or less per day believe they are addicted.
However, heavy smokers are only slightly less likely than light smokers to say they want to quit smoking, though that difference is within the poll's margin of error.
Smokers' Attitudes Toward Smoking, by Amount Smoked Per Day
|
|
Half pack |
More than half a pack |
More than |
|
|
|
|
|
|
Addicted |
60% |
90% |
93% |
|
Would like to quit |
82% |
80% |
74% |
An analysis shows that smokers aged 60 and older are more likely to say they are addicted to cigarettes but less likely to say they want to quit smoking than are smokers aged 18 to 34.
Two in three smokers between the ages of 18 and 34 say they are addicted to smoking, while 80% of smokers in the 35 to 59 age group and 76% of smokers aged 60 and older agree.
A majority of all three smoker age groups express a desire to quit smoking, but a higher proportion of 18- to 34-year-old smokers (80%) and 35- to 59-year-old smokers (80%) do so than do smokers aged 60 and older (69%).
Survey Methods
These results are based on telephone interviews with a randomly selected national sample of 1,006 adults, aged 18 and older, conducted July 7-10, 2005. For results based on this sample, one can say with 95% confidence that the maximum error attributable to sampling and other random effects is ±3 percentage points. In addition to sampling error, question wording and practical difficulties in conducting surveys can introduce error or bias into the findings of public opinion polls.
For results based on the sample of 216 smokers, the maximum margin of sampling error is ±7 percentage points.
For results based on the sample of 790 nonsmokers, the maximum margin of sampling error is ±4 percentage points.
Aggregate analyses are based on a sample of 1,111 smokers taken from telephone interviews conducted in September 2000, July 2002, July 2003, July 2004, and July 2005. For results based on this sample, the maximum margin of error is ±3 percentage points.
Now, turning to another topic,
13. Have you, yourself, smoked any cigarettes in the past week?
|
Yes |
No |
|
|
% |
% |
|
|
2005 Jul 7-10 |
25 |
75 |
|
|
|
|
|
2004 Nov 7-10 |
22 |
78 |
|
2004 Jul 8-11 |
25 |
75 |
|
2003 Nov 3-5 |
26 |
74 |
|
2003 Jul 7-9 |
25 |
75 |
|
2002 Jul 9-11 |
24 |
76 |
|
2001 Jul 19-22 |
28 |
72 |
|
2000 Nov 13-15 |
25 |
75 |
|
1999 Sep 23-26 |
23 |
77 |
|
1998 Jun 22-23 |
28 |
72 |
|
1997 Sep 25-28 |
26 |
74 |
|
1997 Jun 26-29 |
26 |
74 |
|
1997 Jun 23-24 |
26 |
74 |
|
1997 May 6-7 |
25 |
75 |
|
1997 Mar 24-26 |
27 |
73 |
|
1996 May 9-12 |
27 |
73 |
|
1994 Jul 15-17 |
27 |
73 |
|
1994 Mar 11-13 |
27 |
73 |
|
1991 Nov 7-10 |
28 |
72 |
|
1990 Jul 6-8 |
27 |
73 |
|
1989 May 15-18 |
27 |
73 |
|
1989 Apr 4-9 |
29 |
71 |
|
1988 Jul 1-7 |
32 |
68 |
|
1987 Mar 14-18 |
30 |
70 |
|
1986 Jun 9-16 |
31 |
69 |
|
1985 Jun 7-10 |
35 |
65 |
|
1983 |
38 |
62 |
|
1981 Jun 26-29 |
35 |
65 |
|
1978 Jan 20-23 |
36 |
64 |
|
1977 Aug 19-22 |
38 |
62 |
|
1974 May 10-13 |
40 |
60 |
|
1972 Apr 21-24 |
43 |
57 |
|
1971 May 14-17 |
42 |
58 |
|
1969 Jul 24-29 |
40 |
60 |
|
1957 Jun |
42 |
58 |
|
1954 Jun |
45 |
55 |
|
1949 Oct |
44 |
56 |
|
1944 Nov |
41 |
59 |
14. About how many cigarettes do you smoke each day?
BASED ON 216 SMOKERS
|
|
Less than |
|
More than |
|
Mean |
Median |
|
% |
% |
% |
% |
% |
% |
|
|
2005 Jul 7-10 |
58 |
31 |
9 |
2 |
14 |
10 |
|
|
|
|
|
|
|
|
|
2004 Jul 8-11 |
52 |
33 |
14 |
1 |
16 |
15 |
|
2003 Jul 7-9 |
53 |
35 |
10 |
2 |
15 |
12 |
|
2002 Jul 9-11 |
54 |
29 |
17 |
* |
16 |
10 |
|
2001 Jul 19-22 |
59 |
29 |
11 |
* |
15 |
10 |
|
2000 Nov 13-15 |
62 |
29 |
9 |
0 |
15 |
10 |
|
1999 Sep 23-26 |
55 |
35 |
9 |
1 |
14 |
-- |
|
1997 Jun 26-29 |
48 |
32 |
19 |
1 |
-- |
20 |
|
1997 Jun 23-24 |
48 |
30 |
21 |
1 |
19 |
20 |
|
1996 May 9-12 |
43 |
38 |
16 |
3 |
17 |
20 |
|
1994 Mar 11-13 |
44 |
38 |
18 |
0 |
-- |
20 |
|
1991 Nov 7-10 |
48 |
34 |
17 |
1 |
-- |
20 |
|
1990 Jul 5-8 |
51 |
32 |
14 |
3 |
-- |
-- |
|
1989 May 15-18 |
39 |
39 |
20 |
2 |
-- |
20 |
|
1988 Jul 1-7 |
40 |
38 |
20 |
2 |
-- |
20 |
|
1987 Mar 14-18 |
48 |
32 |
18 |
2 |
-- |
20 |
|
1986 Jun 9-16 |
43 |
33 |
22 |
2 |
-- |
20 |
|
1981 Jan 26-29 |
38 |
37 |
24 |
1 |
-- |
20 |
|
1978 Jan 20-23 |
34 |
35 |
30 |
1 |
-- |
20 |
|
1977 Aug 19-22 |
41 |
31 |
27 |
1 |
-- |
20 |
|
1957 Jun |
44 |
41 |
15 |
* |
-- |
20 |
|
1954 Jun |
39 |
35 |
26 |
-- |
-- |
20 |
|
1949 Oct |
42 |
38 |
16 |
4 |
-- |
20 |
|
1944 Nov |
43 |
33 |
22 |
2 |
-- |
20 |
|
* Less than 0.5% |
||||||
15. All things considered, would you like to give up smoking, or not?
BASED ON 216 SMOKERS
|
|
Yes |
No |
No opinion |
|
|
% |
% |
% |
|
2005 Jul 7-10 |
76 |
22 |
2 |
|
|
|
|
|
|
2004 Jul 8-11 |
82 |
17 |
1 |
|
2003 Jul 7-9 |
82 |
17 |
1 |
|
2002 Jul 9-11 |
79 |
18 |
3 |
|
2000 Nov 13-15 |
82 |
16 |
2 |
|
1999 Sep 23-26 |
76 |
23 |
1 |
|
1997 Jun 26-29 |
74 |
24 |
2 |
|
1997 Jun 23-24 |
64 |
34 |
2 |
|
1996 May 9-12 |
73 |
26 |
1 |
|
1994 Mar 11-13 |
70 |
28 |
2 |
|
1991 Nov 7-10 |
76 |
22 |
2 |
|
1990 Jul 6-8 |
74 |
24 |
2 |
|
1989 May 15-18 |
63 |
33 |
4 |
|
1988 Jul 1-7 |
68 |
27 |
5 |
|
1987 Mar 14-18 |
77 |
20 |
3 |
|
1986 Jun 9-16 |
75 |
22 |
3 |
|
1981 Jun 26-29 |
66 |
30 |
4 |
|
1977 Aug 19-22 |
66 |
29 |
5 |
16. Do you consider yourself addicted to cigarettes or not?
BASED ON 216 SMOKERS
|
|
Yes, addicted |
No, not |
No opinion |
|
% |
% |
% |
|
|
2005 Jul 7-10 |
74 |
25 |
1 |
|
|
|
|
|
|
2004 Jul 8-11 |
78 |
21 |
1 |
|
2003 Jul 7-9 |
72 |
28 |
* |
|
2000 Nov 13-15 |
74 |
26 |
0 |
|
1999 Sep 23-26 |
72 |
28 |
* |
|
1997 Jun 26-29 |
73 |
27 |
* |
|
1997 Jun 23-24 |
68 |
31 |
1 |
|
1996 |
69 |
31 |
0 |
|
1991 |
70 |
29 |
1 |
|
1990 |
61 |
39 |
* |
|
* Less than 0.5% |
|||
17. As a result of increased restrictions on smoking in public places, do you feel unjustly discriminated against as a smoker, or do you think the restrictions are justified?
BASED ON 216 SMOKERS
|
|
Yes, unjustly |
No, restrictions |
No |
|
% |
% |
% |
|
|
2005 Jul 7-10 |
39 |
59 |
2 |
|
|
|
|
|
|
2004 Jul 8-11 |
39 |
57 |
4 |
|
2003 Jul 7-9 |
40 |
59 |
1 |
|
2002 Jul 9-11 |
39 |
58 |
3 |
|
2001 Jul 19-22 |
32 |
65 |
3 |
|
1994 Mar 11-13 |
39 |
60 |
1 |
18. Did you, yourself, ever smoke cigarettes on a regular basis?
BASED ON 790 NONSMOKERS
|
|
Yes |
No |
No |
|
% |
% |
% |
|
|
2005 Jul 7-10 |
30 |
70 |
* |
|
|
|
|
|
|
2004 Jul 8-11 |
29 |
71 |
-- |
|
2003 Jul 7-9 |
35 |
65 |
* |
|
2002 Jul 9-11 |
34 |
66 |
* |
|
1997 Jun 26-29 |
32 |
68 |
0 |
|
1996 May 9-12 |
31 |
68 |
1 |
|
1994 Mar 11-13 |
36 |
64 |
-- |
|
1990 Jul 6-8 |
35 |
65 |
-- |
|
* Less than 0.5% |
|||
19. In general, how harmful do you feel secondhand smoke is to adults -- very harmful, somewhat harmful, not too harmful, or not at all harmful?
|
|
|
Somewhat |
Not too |
Not at all |
DEPENDS |
|
|
% |
% |
% |
% |
% |
% |
|
|
2005 Jul 7-10 |
53 |
31 |
12 |
3 |
* |
1 |
|
|
|
|
|
|
|
|
|
2004 Jul 8-11 |
55 |
30 |
9 |
4 |
1 |
1 |
|
2003 Jul 7-9 |
51 |
36 |
9 |
3 |
* |
1 |
|
2002 Jul 9-11 |
56 |
31 |
7 |
4 |
* |
2 |
|
2001 Jul 19-22 |
52 |
33 |
9 |
5 |
* |
1 |
|
1999 Sep 23-26 |
43 |
39 |
11 |
5 |
1 |
1 |
|
1997 Jun 26-29 |
55 |
29 |
9 |
5 |
* |
2 |
|
1996 May 9-12 |
48 |
36 |
9 |
5 |
* |
2 |
|
1994 Mar 11-13 |
36 |
42 |
12 |
6 |
1 |
3 |
|
* Less than 0.5% |
||||||
|
(vol.) = Volunteered response |
||||||
20. In general, how harmful do you feel smoking is to adults who smoke -- very harmful, somewhat harmful, not too harmful, or not at all harmful?
|
|
Very |
Somewhat |
Not too |
Not at all |
DEPENDS |
No |
|
% |
% |
% |
% |
% |
% |
|
|
2005 Jul 7-10 |
81 |
16 |
2 |
1 |
* |
* |
|
|
|
|
|
|
|
|
|
2004 Jul 8-11 |
83 |
14 |
1 |
1 |
* |
1 |
|
2003 Jul 7-9 |
82 |
15 |
2 |
1 |
* |
* |
|
2002 Jul 9-11 |
80 |
15 |
2 |
1 |
1 |
1 |
|
* Less than 0.5% |
||||||
|
(vol.) = Volunteered response |
||||||