GALLUP NEWS SERVICE
PRINCETON, NJ -- Most working adults in the United States tell Gallup they are satisfied with the job they do for a living, just as most married people report that they are satisfied with their spouse -- in both cases, those not satisfied are likely to have already exercised their option to get out of the relationship. Still, there is a difference between those who love their jobs and those who merely like them, which a recent Gallup Poll addressed.
Gallup's annual Work and Education Poll, updated Aug. 8-11, finds that about three in five employed adults in the United States like their jobs; but, a fortunate one-third of workers love their occupations. Only 9% of working adults dislike or hate their jobs.
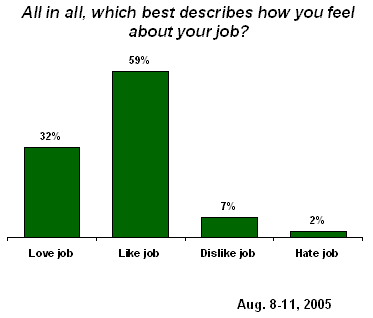
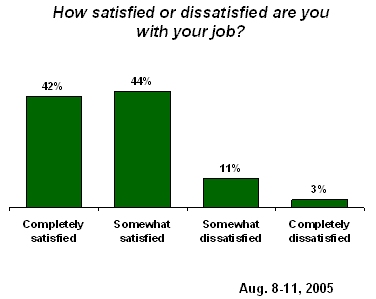
The overall percentage of workers who love or like their jobs (91%) is similar to the overall percentage of people who, in answer to a separate question, say they are satisfied with their jobs (86%). Specifically, 42% are "completely" satisfied and 44% are "somewhat" satisfied.
Naturally, the two measures are highly correlated. Most of those who love their jobs say they are completely satisfied with them. Most of those who merely like their jobs say they are somewhat satisfied with them. (The percentage saying they dislike or hate their job results in too few respondents to analyze with any statistical reliability.)
|
U.S. Working Adults' Job Satisfaction |
||
|
Love |
Like |
|
|
% |
% |
|
|
Completely satisfied |
81 |
26 |
|
Somewhat satisfied |
14 |
66 |
|
Somewhat dissatisfied |
4 |
7 |
|
Completely dissatisfied |
1 |
* |
|
* Less than 0.5% |
||
Interestingly, those working for the government, a non-profit organization, or those who are self-employed are much more likely than those working in private industries to say they love their jobs.
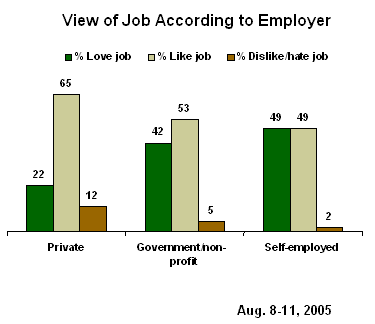
The reasons for satisfaction among the self-employed seem self evident. It is possible that the high satisfaction among government and non-profit workers is due to the more service-oriented nature of work performed by a disproportionate share of government and non-profit workers -- teachers, social workers, protective services, etc. -- as compared with private sector employees. An alternative hypothesis is that private sector employment is more demanding and less secure. Survey data probing employee satisfaction in several specific areas show that government, non-profit, and self-employed workers are more satisfied with their job security and workload than are those employed by companies in the private sector. There is also the possibility that workers who self-select themselves into government or non-profit work are behaviorally or psychologically different to begin with than those who work for for-profit companies.
The Gallup Poll also shows that higher levels of education and income correspond with a higher percentage of workers saying they love their jobs. The percentage of college graduates who love their jobs is 41%, compared with 31% of those with only some college education and 21% of those with no college education. Similarly, 39% of workers living in households making at least $50,000 say they love their jobs, compared with 22% of those living in lower income households.
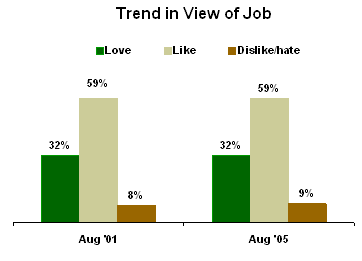
The overall percentages of workers saying they love or like their jobs are exactly the same now as in August 2001.
New to this year's poll is a follow-up question asking workers to give the reasons why they feel the way they do about their jobs. Among the subgroup of workers who are positive about their jobs (those saying they love or like them), the largest segment (20%) simply says they enjoy what they do.
Others who love or like their job supply more intriguing insights, the two foremost being that they like their coworkers and that they enjoy serving or helping the public (13% each). Working with children also ranks high, mentioned by 10% of these workers. Eight percent of these workers mention flexible hours, meeting people, and variety in their work.
It is of interest to note the small percentage of workers who love or like their jobs who mention pay or benefits as the reason. Clearly other non-tangible aspects of the job appear to be most important in producing happy workers.
|
Please tell me what it is about your job that makes you [love/like/dislike/hate] it. |
|
|
Love/Like Job |
|
|
% |
|
|
Like what you do/do what you wanted to do |
20 |
|
Coworkers/fellow employees |
13 |
|
Serving/helping the public |
13 |
|
Working with children |
10 |
|
Hours/flexible schedule |
8 |
|
Interacting with/meeting people |
8 |
|
Different jobs/variety/diversity |
8 |
|
Pay/wages |
7 |
|
Work environment/company |
7 |
|
Challenging |
6 |
|
Autonomy/freedom/independence with job responsibility |
5 |
|
Self-employed/being own boss |
3 |
|
Doing this forever/familiar with it |
2 |
|
Get to be creative |
2 |
|
Work with new technology/products |
2 |
|
Interesting |
2 |
There are a few significant distinctions in the reasons given by those who love their jobs versus those that like their jobs. Those who love their jobs are more likely to say they enjoy working with children (a substantial portion of these workers are teachers and social workers). Those that love their jobs are also more likely to mention they enjoy being their own boss -- a reflection of the fact that self-employment is highly correlated with loving one's job.
Those who merely like their jobs are more likely to say that pay is a factor (although it is still a minor reason), and that they enjoy interacting with or meeting people. There is little distinction between the two groups on the rest of the factors.
What Difference Does Love Make?
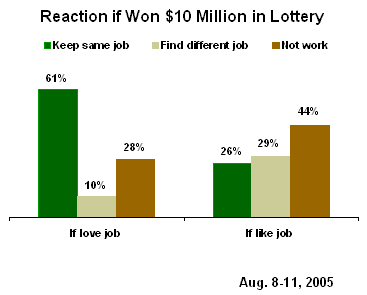
Apparently, loving one's job means sticking with it even if you win the lottery. Gallup asked workers what they would do if the lottery presented them with $10 million in instant wealth. Overall, 36% of workers say they would continue to work in their current jobs, 24% would continue to work but find a different job, and 39% would stop working.
Most of those who love their jobs say they would remain in their same jobs (61%), while 10% would find different jobs and 28% would stop working. The majority of those who like their jobs also say they would continue working, but almost half would stop working. Those who like their jobs and say they would continue working are divided between staying in their same jobs and finding different jobs.
Some Surprising -- and Not So Surprising -- Statistics
The following findings on people's attitudes toward work seem predictable:
- Those whose wages have been reduced in the last five years are less likely than others to say they love their jobs (17% vs. 35%).
- Those whose benefits have been reduced in the last five years are less likely than others to say they love their jobs (23% vs. 36%).
- Those who have switched companies in the last five years are less likely to love their jobs than those who have not switched (25% vs. 36%).
- Those who have changed careers in the last five years are no more likely than others to say they love their jobs (31% vs. 32%).
These findings are a bit more surprising:
- Women are more likely than men to say they love their jobs (40% vs. 25%).
- People who have received promotions in the last five years are no more likely than others to say they love their jobs (33% vs. 31%).
Survey Methods
Results are based on telephone interviews with 1,001 national adults, aged 18 and older, conducted Aug. 8-11, 2005. For results based on the total sample of national adults, one can say with 95% confidence that the maximum margin of sampling error is ±3 percentage points. For results based on the sample of 564 adults employed full or part-time, the maximum margin of sampling error is ±5 percentage points.
15. How satisfied or dissatisfied are you with your job? Would you say you are -- completely satisfied, somewhat satisfied, somewhat dissatisfied, or completely dissatisfied with your job?
BASED ON 564 ADULTS EMPLOYED FULL OR PART-TIME
|
|
Completely satisfied |
Somewhat satisfied |
Somewhat dissatisfied |
Completely dissatisfied |
No |
|
% |
% |
% |
% |
% |
|
|
2005 Aug 8-11 |
42 |
44 |
11 |
3 |
* |
|
|
|
|
|
|
|
|
2004 Aug 9-11 |
50 |
39 |
7 |
4 |
* |
|
2003 Aug 4-6 |
44 |
41 |
11 |
4 |
-- |
|
2002 Aug 5-8 |
43 |
46 |
9 |
2 |
* |
|
2001 Aug 16-19 |
41 |
44 |
11 |
4 |
-- |
|
1999 Aug 24-26 |
39 |
47 |
12 |
2 |
* |
|
1997 Aug 22-25 |
35 |
51 |
10 |
3 |
1 |
|
1989 Jul 18-21 |
28 |
61 |
8 |
3 |
* |
|
* Less than 0.5% |
|||||
16. All in all, which of the following best describes how you feel about your job -- [ROTATED: you love it, you like it, you dislike it, (or) you hate it]?
BASED ON 564 ADULTS EMPLOYED FULL OR PART-TIME
|
|
|
|
|
NEITHER (vol.) |
No |
|
|
|
|
|
|
|
|
|
|
2005 Aug 8-11 |
32% |
59 |
7 |
2 |
* |
-- |
|
|
|
|
|
|
|
|
|
2001 Aug 16-19 |
32% |
59 |
6 |
2 |
1 |
-- |
|
* Less than 0.5% |
||||||
17. Please tell me what it is about your job that makes you [love/like/dislike/hate] it. [OPEN-ENDED]
|
|
All employees ^ |
Love |
Like |
|
Like what you do/what you wanted to do |
17 |
19 |
18 |
|
Coworkers/fellow employees |
14 |
14 |
12 |
|
Serving/helping the public |
11 |
13 |
12 |
|
Hours/flexible schedule |
8 |
8 |
9 |
|
Pay/wages |
8 |
4 |
9 |
|
Working with children |
8 |
14 |
6 |
|
Interacting with/meeting people |
8 |
5 |
10 |
|
Different jobs/variety/diversity |
7 |
11 |
7 |
|
Work environment/company |
6 |
5 |
7 |
|
Challenging |
5 |
4 |
6 |
|
Autonomy/freedom/independence with job responsibility |
4 |
6 |
4 |
|
Self-employed/being own boss |
3 |
6 |
2 |
|
Doing this forever/familiar with it |
2 |
1 |
3 |
|
Get to be creative |
2 |
2 |
2 |
|
Work with new technology/products |
2 |
1 |
2 |
|
Interesting |
1 |
1 |
2 |
|
Other |
9 |
6 |
5 |
|
Nothing |
* |
* |
* |
|
Everything |
* |
-- |
* |
|
No opinion |
* |
-- |
* |
|
* Less than 0.5% |
|||
|
^ Based on 564 adults employed full or part-time |
|||
|
† Based on 193 employed adults who say they love their job; +/-8 pct. pts. |
|||
|
‡ Based on 322 employed adults who say they like their job; +/- 6 pct. pts. |
|||

