GALLUP NEWS SERVICE
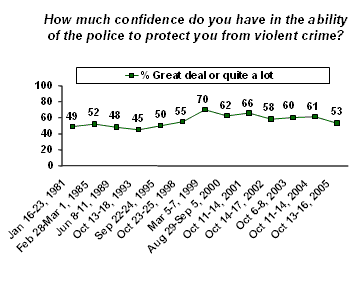
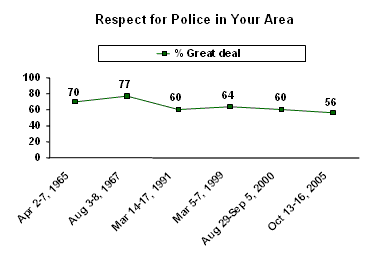
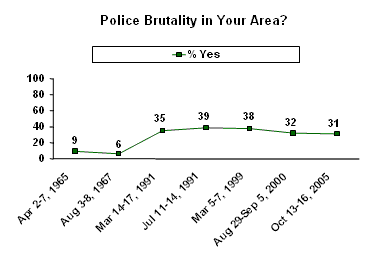
PRINCETON, NJ -- After several years of stable readings, Gallup's latest update on confidence in the police to protect people from violent crime has fallen this year, to a level not seen since 1995. The decline in confidence has generally occurred across demographic subgroups, as members of most key groups are less confident in the police this year than last. Gallup also finds a new low in the percentage of Americans who say they have a "great deal" of respect for the police in their area. Meanwhile, there has been no change in Americans' beliefs about police brutality occurring in their local areas.
Gallup's annual Crime Poll, conducted Oct. 13-16, finds 53% of Americans with "a great deal" or "quite a lot" of confidence in the police to protect them from violent crime. Last year, 61% expressed the same level of confidence. Confidence in this regard has been near or above 60% since 1998.

The decline in confidence is probably a recent phenomenon. When Gallup asked its "confidence in institutions" question sequence in May 2005, there was little change in expressed confidence in the police compared with May 2004. One possible reason for the decline is that the poll was conducted shortly after media reports showed video of an Oct. 8 arrest during which New Orleans police allegedly beat a man outside a club in that city. Another possibility is that ratings of police are being dragged down by the same forces that are causing declines in ratings of the president, Congress, and overall satisfaction with the way things are going in the country.
The decline is evident among most demographic groups. There are some exceptions to that general pattern, as non-whites, older Americans (aged 65 and older), urban residents, political moderates, and independents have shown little change since 2004. Those whose households were victimized by crime in the last 12 months also show no change in confidence; however, their expressed level of confidence in 2004 was among the lowest of all subgroups.
A comparison of the current data with data from 1999 (the high point in measured confidence) shows that confidence in the police among non-whites, moderates, and independents decreased prior to this year, and no additional deterioration has occurred in the last 12 months.
Interestingly, older Americans are about as confident in the police now (72%) as they were during the high point of 1999 (76%).
|
Confidence in Police, Selected Years |
|||
|
1999 |
2004 |
2005 |
|
|
% |
% |
% |
|
|
Overall |
70 |
61 |
53 |
|
|
|
|
|
|
Men |
68 |
58 |
50 |
|
Women |
71 |
64 |
56 |
|
|
|
|
|
|
White |
73 |
66 |
57 |
|
Non-white |
57 |
44 |
40 |
|
Black |
54 |
32 |
32 |
|
|
|
|
|
|
18- to 29-year-olds |
66 |
51 |
43 |
|
30- to 49-year-olds |
68 |
61 |
56 |
|
50- to 64-year-olds |
71 |
60 |
46 |
|
65 years old and older |
76 |
74 |
72 |
|
|
|
|
|
|
East |
69 |
65 |
57 |
|
Midwest |
71 |
62 |
52 |
|
South |
67 |
58 |
52 |
|
West |
73 |
62 |
54 |
|
|
|
|
|
|
Urban |
N/A |
55 |
54 |
|
Suburban |
N/A |
66 |
54 |
|
Rural |
N/A |
59 |
50 |
|
|
|
|
|
|
High school grad or less |
68 |
59 |
52 |
|
Some college |
67 |
60 |
49 |
|
College grad |
77 |
64 |
59 |
|
Post-grad |
78 |
68 |
59 |
|
|
|
|
|
|
Less than $30,000 |
66 |
52 |
50 |
|
$30,000 to $74,999 |
71 |
63 |
52 |
|
$75,000 or more |
79 |
67 |
57 |
|
|
|
|
|
|
Liberal |
64 |
57 |
40 |
|
Moderate |
72 |
61 |
57 |
|
Conservative |
71 |
66 |
58 |
|
|
|
|
|
|
Democrat |
68 |
58 |
52 |
|
Independent |
65 |
48 |
49 |
|
Republican |
79 |
78 |
60 |
|
|
|
|
|
|
Married |
N/A |
68 |
58 |
|
Not married |
N/A |
53 |
48 |
|
|
|
|
|
|
Children under age 18 |
N/A |
58 |
54 |
|
No children under age 18 |
N/A |
63 |
54 |
|
|
|
|
|
|
Employed |
N/A |
60 |
49 |
|
Not employed |
N/A |
64 |
60 |
|
|
|
|
|
|
Attend church weekly |
N/A |
66 |
61 |
|
Attend church nearly weekly/monthly |
N/A |
68 |
57 |
|
Seldom/never attend |
N/A |
55 |
48 |
|
|
|
|
|
|
Gun in household |
N/A |
63 |
52 |
|
No gun |
N/A |
61 |
54 |
|
|
|
|
|
|
Crime victim, last 12 months |
N/A |
48 |
46 |
|
Not crime victim |
N/A |
67 |
56 |
Gallup also measures a new low in the public's respect for the police in their local area, a question that Gallup has asked periodically since 1965. Fifty-six percent of Americans now say they have a great deal of respect for the police in their area. The last time Gallup asked this question, in 2000, 60% said they respected the police in their area a great deal. During the 1960s, greater than 7 in 10 Americans had a great deal of respect for their local police.

One measure that does not show any change is the public's perception of the existence of police brutality in their area. Thirty-one percent of Americans believe there is police brutality in their area, while 65% say there is not. That compares with a Gallup finding in 2000, when 32% said they believed police brutality existed in their area. The two most recent measurements represent a decline from the 1990s, but are much higher than Gallup measured in the 1960s, when fewer than 1 in 10 Americans thought police brutality was occurring in their local areas.

Survey Methods
These results are based on telephone interviews with a randomly selected national sample of 1,012 adults, aged 18 and older, conducted Oct. 13-16, 2005. For results based on this sample, one can say with 95% confidence that the maximum error attributable to sampling and other random effects is ±3 percentage points. In addition to sampling error, question wording and practical difficulties in conducting surveys can introduce error or bias into the findings of public opinion polls.
15. How much confidence do you have in the ability of the police to protect you from violent crime -- a great deal, quite a lot, not very much, or none at all?
|
|
A great |
Quite |
Not very |
None |
No |
|
% |
% |
% |
% |
% |
|
|
2005 Oct 13-16 |
18 |
35 |
39 |
7 |
1 |
|
|
|
|
|
|
|
|
2004 Oct 11-14 |
21 |
40 |
28 |
10 |
1 |
|
2003 Oct 6-8 |
20 |
40 |
31 |
8 |
1 |
|
2002 Oct 14-17 |
19 |
39 |
31 |
9 |
2 |
|
2001 Oct 11-14 |
25 |
41 |
27 |
6 |
1 |
|
2000 Aug 29-Sep 5 |
20 |
42 |
31 |
6 |
1 |
|
1999 Mar 5-7 |
29 |
41 |
25 |
4 |
1 |
|
1998 Oct 23-25 |
19 |
36 |
37 |
8 |
* |
|
1995 Sep 22-24 |
20 |
30 |
39 |
9 |
2 |
|
1993 Oct 13-18 |
14 |
31 |
45 |
9 |
1 |
|
1989 Jun 8-11 |
14 |
34 |
42 |
8 |
2 |
|
1985 Feb 28-Mar 1 |
15 |
37 |
39 |
6 |
3 |
|
1981 Jan 16-23 |
15 |
34 |
42 |
8 |
1 |
|
* Less than 0.5% |
|||||
16. How much respect do you have for the police in your area -- a great deal, some, or hardly any?
|
A great deal |
Some |
Hardly any |
No opinion |
|
|
% |
% |
% |
% |
|
|
2005 Oct 13-16 |
56 |
33 |
11 |
* |
|
|
|
|
|
|
|
2000 Aug 29-Sep 5 |
60 |
30 |
9 |
1 |
|
1999 Mar 5-7 |
64 |
29 |
7 |
* |
|
1991 Mar 14-17 |
60 |
32 |
7 |
1 |
|
1967 Aug 3-8 |
77 |
17 |
4 |
2 |
|
1965 Apr 2-7 |
70 |
22 |
4 |
4 |
|
* Less than 0.5% |
||||
17. In some places in the nation, there have been charges of police brutality. Do you think there is any police brutality in your area, or not?
|
Yes |
No |
No opinion |
|
|
% |
% |
% |
|
|
2005 Oct 13-16 |
31 |
65 |
4 |
|
|
|
|
|
|
2000 Aug 29-Sep 5 |
32 |
65 |
3 |
|
1999 Mar 5-7 |
38 |
57 |
5 |
|
1991 Jul 11-14 |
39 |
56 |
5 |
|
1991 Mar 14-17 |
35 |
60 |
5 |
|
1967 Aug 3-8 |
6 |
81 |
13 |
|
1965 Apr 2-7 |
9 |
79 |
12 |
