GALLUP NEWS SERVICE
PRINCETON, NJ -- The latest annual Gallup Poll on health finds a modest drop in the percentage of Americans giving a high rating to the quality and coverage of healthcare in this country, as well as a significant increase in the percentage of Americans favoring a government healthcare system. Overall, Americans continue to rate healthcare quality much higher than healthcare coverage, and to rate their own healthcare more positively than what the general public receives.
Healthcare in the United States
The poll, conducted Nov. 7-10, finds Americans somewhat more positive than negative about the overall quality of healthcare in the country. By a margin of 53% to 47%, Americans say U.S. healthcare quality is excellent or good, rather than fair or poor. Those figures are down from a 59% to 40% rating last year and a 60% to 40% rating in 2003. The current figures are in line with what Gallup measured in 2001 and 2002.
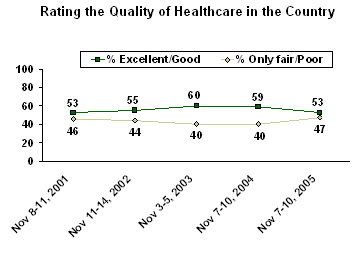
Increasingly negative perceptions of national healthcare quality this year compared to last are most evident among Republicans, women, and those with household incomes of $50,000 or greater.
Quality of Healthcare in the United States: Percentage Saying Excellent or Good
|
2004 |
2005 |
Difference |
|
|
% |
% |
|
|
|
Overall |
59 |
53 |
-6 |
|
|
|
|
|
|
Gender |
|
|
|
|
Male |
63 |
60 |
-3 |
|
Female |
57 |
46 |
-11 |
|
Age |
|
|
|
|
18-29 |
46 |
42 |
-4 |
|
30-49 |
67 |
53 |
-14 |
|
50-64 |
62 |
57 |
-5 |
|
65+ |
55 |
60 |
+5 |
|
Income |
|
|
|
|
<$30,000 |
45 |
48 |
+3 |
|
$30,000-<$50,000 |
54 |
50 |
-4 |
|
$50,000-<$75,000 |
72 |
50 |
-22 |
|
$75,000+ |
75 |
62 |
-13 |
|
Party |
|
|
|
|
Republican |
74 |
63 |
-11 |
|
Independent |
59 |
53 |
-6 |
|
Democrat |
45 |
44 |
-1 |
Perceptions of healthcare coverage in the United States, which have been more negative than positive since Gallup first asked the question in 2001, have fallen to their lowest point in the last five years. Just 21% give an excellent or good rating to U.S. healthcare coverage, while 78% rate it as only fair (43%) or poor (35%). In the previous four years, excellent/good ratings ranged between 28% and 30%.
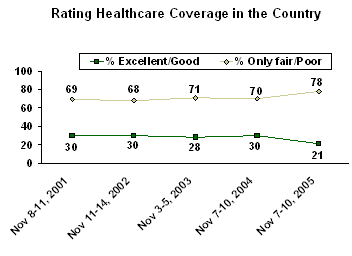
As with ratings of healthcare quality, women, Republicans, and those residing in higher-income households show the greatest declines in their ratings of national healthcare coverage compared with last year. Those in the middle age categories -- between ages 30 and 64 -- also show significant declines.
Healthcare Coverage in the United States: Percentage Saying Excellent or Good
|
2004 |
2005 |
Difference |
|
|
% |
% |
|
|
|
Overall |
30 |
21 |
-9 |
|
|
|
|
|
|
Male |
32 |
26 |
-6 |
|
Female |
28 |
17 |
-11 |
|
Age |
|
|
|
|
18-29 |
17 |
18 |
+1 |
|
30-49 |
31 |
17 |
-14 |
|
50-64 |
34 |
23 |
-11 |
|
65+ |
33 |
30 |
-3 |
|
Income |
|
|
|
|
<$30,000 |
21 |
16 |
-5 |
|
$30,000-<$50,000 |
27 |
17 |
-10 |
|
$50,000-<$75,000 |
42 |
29 |
-13 |
|
$75,000+ |
34 |
22 |
-12 |
|
Party |
|
|
|
|
Republican |
47 |
32 |
-15 |
|
Independent |
24 |
21 |
-3 |
|
Democrat |
15 |
11 |
-4 |
Perhaps as a result of the increasingly negative perceptions of healthcare quality and coverage in the United States, the percentage of Americans favoring a government-run healthcare system has reached a five-year high at 41%. The plurality still favors maintaining the current system (49%); however, the percentage that does so is roughly 10 points lower than what it has been in previous surveys.
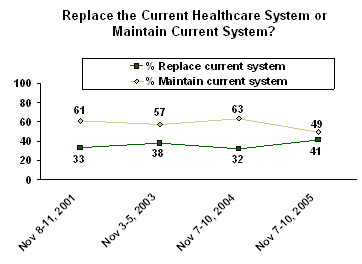
Other measures in the poll show stable results compared with previous years. Just 20% of Americans say they are satisfied with the total cost of healthcare in this country, while 79% are dissatisfied. Also, 70% of Americans say the healthcare system has major problems (52%) or go even further and say it is in a state of crisis (18%). The percentage of Americans giving either of these responses has been around 70% each time the question has been asked, aside from an unusually low 49% reading shortly after the Sept. 11 terrorist attacks.
Personal Healthcare
Respondents continue to be more positive when evaluating their own healthcare than the larger U.S. healthcare system. Seventy-eight percent rate the quality of healthcare they receive as excellent or good, and 63% rate their coverage in those terms.
Comparison of Healthcare Ratings, National vs. Personal
|
Quality |
Coverage |
|||
|
U.S. |
Personal |
U.S. |
Personal |
|
|
% |
% |
% |
% |
|
|
Excellent |
16 |
29 |
2 |
20 |
|
Good |
37 |
49 |
19 |
43 |
|
Only fair |
33 |
17 |
43 |
21 |
|
Poor |
14 |
3 |
35 |
11 |
|
Total Exc/Good |
53 |
78 |
21 |
63 |
|
Total Fair/Poor |
47 |
20 |
78 |
32 |
An analysis of individuals' responses to the national and personal healthcare questions shows that 44% rate their own healthcare quality higher than they rate national healthcare quality. Forty-seven percent give the same ratings to both, and 9% rate national healthcare quality better than their own healthcare.
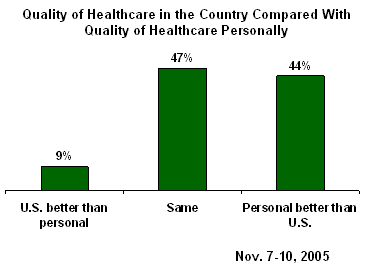
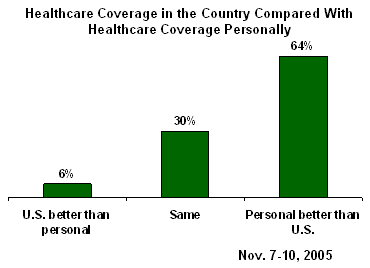
Many more, 64%, rate their healthcare coverage more positively than they rate coverage in the United States more generally. Thirty percent give the same ratings to both, and 6% rate U.S. healthcare coverage as better than what they personally receive.
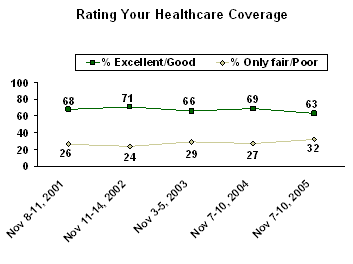
Ratings of personal healthcare coverage overall show a modest decline, from a 69% excellent/good rating last year to 63% this year. The percentage rating their coverage as excellent has dropped from 28% in 2004 to 20% this year.
Apparently, the change is not due to increased insurance costs. The percentage of people with private insurance who say they are paying more for health premiums has not changed since last year, nor has the percentage of Americans who are satisfied with the total cost they pay for healthcare.
Costs of Health Insurance
|
Amount paying for insurance gone up in past year (among those who pay all or part of premiums on private health insurance) |
|
|
2005 |
74% |
|
2004 |
76% |
|
2003 |
74% |
|
Satisfied with total cost paid for healthcare (among all Americans) |
|
|
2005 |
57% |
|
2004 |
58% |
|
2003 |
57% |
|
2002 |
58% |
|
2001 |
64% |
Americans are about as likely to give excellent or good ratings to the quality of the healthcare they receive as they have been in the past. Seventy-eight percent rate their healthcare quality as excellent or good, compared with 80% in 2004, a change that is within the poll's margin of error.
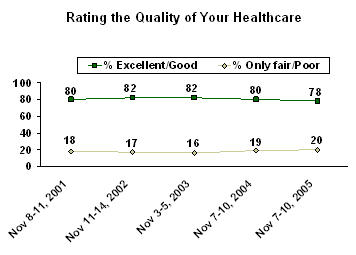
However, there has been a decline in the percentage of Americans rating their healthcare quality as excellent, from 38% last year to 29% this year. Last year's rating was slightly higher than what Gallup had measured in previous years, so the change may just reflect a return to more typical levels.
Survey Methods
These results are based on telephone interviews with a randomly selected national sample of 1,011 adults, aged 18 and older, conducted Nov. 7-10, 2005. For results based on this sample, one can say with 95% confidence that the maximum error attributable to sampling and other random effects is ±3 percentage points. In addition to sampling error, question wording and practical difficulties in conducting surveys can introduce error or bias into the findings of public opinion polls.
Now thinking about healthcare in the country as a whole,
11. Overall, how would you rate -- [ROTATED] -- as excellent, good, only fair, or poor?
A. The quality of healthcare in this country
|
Excellent |
Good |
Only fair |
Poor |
No opinion |
|
|
% |
% |
% |
% |
% |
|
|
2005 Nov 7-10 |
16 |
37 |
33 |
14 |
* |
|
2004 Nov 7-10 |
20 |
39 |
28 |
12 |
1 |
|
2003 Nov 3-5 |
18 |
42 |
28 |
12 |
* |
|
2002 Nov 11-14 |
14 |
41 |
32 |
12 |
1 |
|
2001 Nov 8-11 |
15 |
38 |
34 |
12 |
1 |
|
* Less than 0.5% |
|||||
B. Healthcare coverage in this country
|
Excellent |
Good |
Only fair |
Poor |
No opinion |
|
|
% |
% |
% |
% |
% |
|
|
2005 Nov 7-10 |
2 |
19 |
43 |
35 |
1 |
|
2004 Nov 7-10 |
4 |
26 |
41 |
29 |
* |
|
2003 Nov 3-5 |
5 |
23 |
42 |
29 |
1 |
|
2002 Nov 11-14 |
4 |
26 |
41 |
27 |
2 |
|
2001 Nov 8-11 |
5 |
25 |
43 |
26 |
1 |
|
* Less than 0.5% |
|||||
Thinking again about healthcare in the country as a whole,
28. Are you generally satisfied or dissatisfied with the total cost of healthcare in this country?
|
Satisfied |
Dissatisfied |
No opinion |
|
|
% |
% |
% |
|
|
2005 Nov 7-10 |
20 |
79 |
1 |
|
2004 Nov 7-10 |
21 |
78 |
1 |
|
2003 Nov 3-5 |
20 |
79 |
1 |
|
2002 Nov 11-14 |
22 |
75 |
3 |
|
2001 Nov 8-11 |
28 |
71 |
1 |
|
1993 May 10-12 ^ |
8 |
90 |
2 |
|
^ WORDING: Now, thinking about healthcare in the country as a whole, are you generally satisfied, or dissatisfied, with ... . Next, … the total cost of healthcare in this country. |
|||
29. Which of these statements do you think best describes the U.S. healthcare system today -- [ROTATED: it is in a state of crisis, it has major problems, it has minor problems, (or) it does not have any problems]?
|
|
|
|
Does not |
|
|
|
% |
% |
% |
% |
% |
|
|
2005 Nov 7-10 |
18 |
52 |
28 |
1 |
1 |
|
2004 Nov 7-10 |
14 |
53 |
31 |
2 |
* |
|
2003 Nov 3-5 |
14 |
54 |
30 |
1 |
1 |
|
2002 Nov 11-14 |
11 |
54 |
32 |
2 |
1 |
|
2001 Nov 8-11 |
5 |
44 |
47 |
2 |
2 |
|
2000 Sep 11-13 |
12 |
58 |
28 |
1 |
1 |
|
1994 Sep 6-7 ^ |
17 |
52 |
29 |
1 |
1 |
|
^ WORDING: Which of these statements do you think best describes the U.S. healthcare system today -- the healthcare system is in a state of crisis, it has major problems, it has minor problems, or it does not have any problems? |
|||||
|
* Less than 0.5% |
|||||
Q.30-31 SPLIT SAMPLED
30. Do you think it is the responsibility of the federal government to make sure all Americans have healthcare coverage, or is that not the responsibility of the federal government?
BASED ON 510 NATIONAL ADULTS IN FORM A
|
Yes, government |
No, not |
No |
|
|
% |
% |
% |
|
|
2005 Nov 7-10 ^ |
58 |
38 |
4 |
|
2004 Nov 7-10 ^ |
64 |
34 |
2 |
|
2003 Nov 3-5 ^ |
59 |
39 |
2 |
|
2002 Nov 11-14 |
62 |
35 |
3 |
|
2001 Nov 8-11 ^ |
62 |
34 |
4 |
|
2000 Sep 11-13 |
64 |
31 |
5 |
|
2000 Jan 13-16 |
59 |
38 |
3 |
|
^ Asked of a half sample |
|||
31. Which of the following approaches for providing healthcare in the United States would you prefer -- [ROTATED: replacing the current healthcare system with a new government-run healthcare system, (or) maintaining the current system based mostly on private health insurance]?
BASED ON 501 NATIONAL ADULTS IN FORM B
|
Replacing the |
Maintaining the |
No |
|
|
% |
% |
% |
|
|
2005 Nov 7-10 |
41 |
49 |
10 |
|
2004 Nov 7-10 |
32 |
63 |
5 |
|
2003 Nov 3-5 |
38 |
57 |
5 |
|
2001 Nov 8-11 |
33 |
61 |
6 |
34. Who pays the cost of premiums on your health insurance? Do you or someone in your household pay the total cost, does an employer pay the total cost, or is the cost shared between the employer and you or someone in your household?
BASED ON 594 ADULTS WITH PRIVATE HEALTH INSURANCE
|
Self/ |
|
|
|
|
|
|
% |
% |
% |
% |
% |
|
|
2005 Nov 7-10 |
18 |
14 |
65 |
2 |
1 |
|
2004 Nov 7-10 |
18 |
17 |
64 |
1 |
* |
|
2003 Nov 3-5 |
23 |
16 |
59 |
2 |
* |
|
2002 Nov 11-14 |
21 |
19 |
57 |
2 |
1 |
|
2001 Nov 8-11 |
19 |
24 |
54 |
2 |
1 |
|
* Less than 0.5% |
|||||
|
(vol.) Volunteered response |
|||||
35. Over the past year, has the amount YOU paid for your and your family's health insurance -- [ROTATED: gone up a lot, gone up a little, not changed, gone down a little, (or) gone down a lot]?
BASED ON 500 ADULTS WHO PAY ALL OR PART OF THEIR HEALTH PREMIUMS
|
Gone up |
Gone up |
Not changed |
Gone down |
Gone down |
|
|
|
% |
% |
% |
% |
% |
% |
|
|
2005 Nov 7-10 |
28 |
46 |
23 |
2 |
* |
1 |
|
2004 Nov 7-10 |
28 |
48 |
17 |
5 |
1 |
1 |
|
2003 Nov 3-5 |
31 |
43 |
23 |
* |
1 |
2 |
|
* Less than 0.5% |
||||||
38. Overall, how would you rate -- [ROTATED] -- as excellent, good, only fair, or poor?
A. The quality of healthcare you receive
|
|
|
|
|
NOT |
|
|
|
% |
% |
% |
% |
% |
% |
|
|
2005 Nov 7-10 |
29 |
49 |
17 |
3 |
2 |
* |
|
2004 Nov 7-10 |
38 |
42 |
15 |
4 |
1 |
-- |
|
2003 Nov 3-5 |
33 |
49 |
13 |
3 |
2 |
* |
|
2002 Nov 11-14 |
28 |
54 |
14 |
3 |
1 |
* |
|
2001 Nov 8-11 |
31 |
49 |
15 |
3 |
2 |
* |
|
* Less than 0.5% |
||||||
|
(vol.) Volunteered response |
||||||
B. Your healthcare coverage
|
|
|
|
|
NOT |
|
|
|
% |
% |
% |
% |
% |
% |
|
|
2005 Nov 7-10 |
20 |
43 |
21 |
11 |
4 |
1 |
|
2004 Nov 7-10 |
28 |
41 |
20 |
7 |
4 |
* |
|
2003 Nov 3-5 |
22 |
44 |
23 |
6 |
5 |
* |
|
2002 Nov 11-14 |
20 |
51 |
17 |
7 |
4 |
1 |
|
2001 Nov 8-11 |
22 |
46 |
20 |
6 |
5 |
1 |
|
* Less than 0.5% |
||||||
|
(vol.) Volunteered response |
||||||
39. Are you generally satisfied or dissatisfied with the total cost you pay for your healthcare?
|
Satisfied |
Dissatisfied |
No opinion |
|
|
% |
% |
% |
|
|
2005 Nov 7-10 |
57 |
41 |
2 |
|
2004 Nov 7-10 |
58 |
41 |
1 |
|
2003 Nov 3-5 |
57 |
41 |
2 |
|
2002 Nov 11-14 |
58 |
39 |
3 |
|
2001 Nov 8-11 |
64 |
33 |
3 |