GALLUP NEWS SERVICE
PRINCETON, NJ -- Gallup's annual Health and Healthcare poll finds that most Americans say they are presently in good physical health. The poll also finds that poor health affected Americans an average of four days in the month before the survey, but it only kept them from their typical activities an average of two days. Age, household income, and race are related to people's health assessments, with older Americans, lower-income Americans, and blacks less likely to describe their health positively.
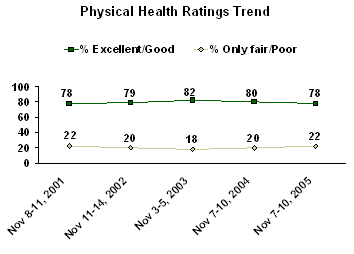
The poll, conducted Nov. 7-10, 2005, finds that roughly three in four Americans describe their physical health as "excellent" (28%) or "good" (50%). Roughly one in five Americans say their health is "only fair" (18%) or "poor" (4%). These results have fluctuated only modestly since Gallup first asked this question in 2001, with the positive health assessment ranging from a low of 78% to a high of 82% over this period.

On average, Americans say they experienced poor health on four days in the last month. About half of Americans (53%) experienced no such days, 23% had up to four poor physical health days, and 21% had five or more days.
While Americans averaged four poor physical health days in the past month, poor physical health kept them from "doing their usual activities, like self-care, work, or recreation" an average of only two days. The vast majority -- 73% -- did not have any days in the past month in which poor physical health kept them from their normal routines. Fourteen percent experienced up to four such days, and 11% had five days or more. (Those who say they experienced at least one day of poor health in the past month report an average of four days in which their health prevented them from doing their normal activities.) Results on this question essentially have not changed since Gallup first asked about it in 2001.
Older Americans Less Likely to Rate Health Positively
Most Americans describe their physical health as excellent or good, but there are some variations by age, household income, and race. To closely examine these variations, Gallup combined the results of its last three surveys in which this question was asked, from November 2003 through November 2005.
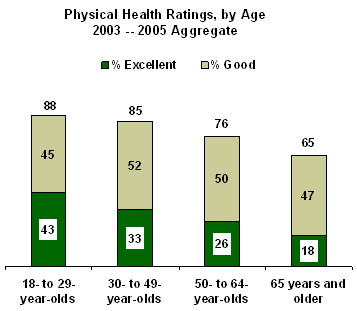
Perhaps not surprisingly, older Americans are much less likely than younger Americans to describe their physical health as excellent or good. Among 18- to 29-year-olds, 88% say they are in excellent or good physical health, while 85% of 30- to 49-year-olds, 76% of 50- to 64-year-olds, and 65% of those aged 65 and older describe their health this way.

There are vast differences by age among those who describe their physical health as excellent. More than 4 in 10 adults aged 18 to 29 say their physical health is excellent. This percentage is lower among older Americans: 33% among 30- to 49-year-olds, 26% among adults aged 50 to 64, and only 18% among adults aged 65 and older.
Although older Americans are less likely than younger Americans to describe their health positively, the data show only modest variations regarding the number of days of poor health in the past month. Americans younger than age 50 say they experienced an average of three days of poor physical health in the last month, compared with an average of four days for those aged 50 to 64 and five days for those aged 65 and older.
Physical Health Ratings Linked to Income
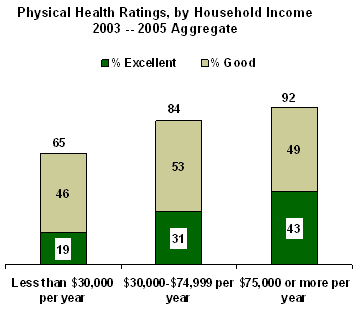
Americans residing in households earning $75,000 per year or more are more likely to describe their physical health positively than those living in households with lower annual incomes. Roughly two in three adults in households earning less than $30,000 per year describe their health as excellent or good. This compares with 84% of those earning between $30,000 and $75,000 per year and 92% of those earning $75,000 per year or more. These income differences are related to age, with older Americans who report lower annual incomes being much more likely to describe their health negatively.

Again, the data show some interesting differences by income among those who describe their health as excellent. Just 19% of those in households earning less than $30,000 per year describe their health in the most positive terms, while 31% of those earning between $30,000 and $75,000 and 43% of those earning $75,000 or more describe it this way.
The data also show that Americans earning $75,000 or more per year experienced fewer days of poor physical health in the last month. On average, those earning less than $30,000 per year experienced six days of poor physical health in the past month. Among those earning between $30,000 and $75,000 per year, the average number of days is three, and among those earning $75,000 or more per year, it's two days.
Physical Health Ratings Differ Between Whites and Blacks
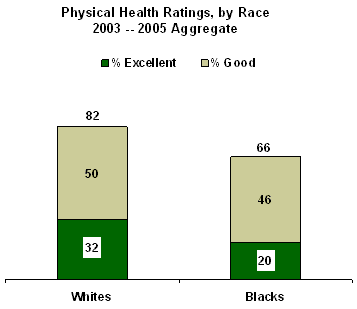
Gallup's aggregate data also show that race is related to ratings of one's physical health, with whites more positive than blacks are in their overall evaluations. Overall, 82% of whites describe their health as excellent or good. This compares with 66% of blacks who describe their health in this way.

Survey Methods
Results are based on telephone interviews with 1,011 national adults, aged 18 and older, conducted Nov. 7-10, 2005. For results based on the total sample of national adults, one can say with 95% confidence that the margin of sampling error is ±3 percentage points.
For results based on the sample of 432 adults who experienced at least one day of poor physical health in the past month, the maximum margin of sampling error is ±5 percentage points.
In addition to sampling error, question wording and practical difficulties in conducting surveys can introduce error or bias into the findings of public opinion polls.
12. How would you describe your own physical health at this time? Would you say your physical health is -- excellent, good, only fair, or poor?
|
Excellent |
Good |
Only fair |
Poor |
No opinion |
|
|
% |
% |
% |
% |
% |
|
|
2005 Nov 7-10 |
28 |
50 |
18 |
4 |
* |
|
|
|
|
|
|
|
|
2004 Nov 7-10 |
32 |
48 |
14 |
6 |
* |
|
2003 Nov 3-5 |
32 |
50 |
14 |
4 |
* |
|
2002 Nov 11-14 |
34 |
45 |
14 |
6 |
1 |
|
2001 Nov 8-11 |
29 |
49 |
17 |
5 |
* |
|
*Less than 0.5% |
|
|
|
|
|
13. Now, thinking about your physical health, for how many days during the past month was your physical health not good? [Open-ended]
|
|
Less |
|
|
|
|
|
|
|
|
|
|
|
% |
% |
% |
% |
% |
% |
% |
% |
% |
|
|
|
|
2005 Nov 7-10 |
53 |
* |
9 |
7 |
5 |
2 |
11 |
10 |
3 |
3.6 |
0 |
|
|
|
|
|
|
|
|
|
|
|
|
|
|
2004 Nov 7-10 |
56 |
* |
9 |
8 |
3 |
2 |
9 |
12 |
1 |
4.0 |
0 |
|
2003 Nov 3-5 |
54 |
1 |
7 |
9 |
6 |
3 |
8 |
10 |
1 |
3.4 |
0 |
|
2002 Nov 11-14 |
54 |
1 |
7 |
9 |
5 |
2 |
9 |
10 |
3 |
3.5 |
0 |
|
2001 Nov 8-11 |
52 |
* |
7 |
9 |
4 |
3 |
11 |
12 |
2 |
4.0 |
0 |
|
*Less than 0.5% |
|||||||||||
14. During the past month, for about how many days did poor physical health keep you from doing your usual activities, such as self-care, work, or recreation? [Open-ended]
|
|
Less |
|
|
|
|
|
|
|
|
|
|
|
% |
% |
% |
% |
% |
% |
% |
% |
% |
|
|
|
|
National Adults |
|||||||||||
|
2005 Nov 7-10 |
73 |
* |
5 |
4 |
4 |
1 |
5 |
6 |
2 |
1.8 |
0 |
|
2004 Nov 7-10 |
71 |
-- |
7 |
4 |
2 |
1 |
5 |
8 |
2 |
2.6 |
0 |
|
2003 Nov 3-5 |
74 |
* |
5 |
4 |
2 |
1 |
5 |
6 |
2 |
2.0 |
0 |
|
2002 Nov 11-14 |
72 |
* |
5 |
4 |
3 |
1 |
5 |
7 |
3 |
2.4 |
0 |
|
2001 Nov 8-11 |
73 |
* |
5 |
4 |
3 |
2 |
6 |
7 |
* |
2.3 |
0 |
|
|
|
|
|
|
|
|
|
|
|
|
|
|
Experienced Poor Physical Health ^ |
|||||||||||
|
2005 Nov 7-10 |
46 |
* |
10 |
10 |
9 |
3 |
10 |
11 |
1 |
4.0 |
1 |
|
2004 Nov 7-10 |
34 |
-- |
16 |
10 |
5 |
3 |
12 |
19 |
1 |
6.1 |
1 |
|
2003 Nov 3-5 |
43 |
* |
12 |
10 |
5 |
3 |
12 |
13 |
2 |
4.4 |
1 |
|
2002 Nov 11-14 |
41 |
1 |
11 |
9 |
6 |
2 |
12 |
17 |
1 |
5.3 |
1 |
|
2001 Nov 8-11 |
43 |
* |
10 |
8 |
7 |
3 |
14 |
14 |
* |
5.0 |
1 |
|
*Less than 0.5% |
|||||||||||
|
^BASED ON 432 WHO EXPERIENCED DAY(S) OF POOR PHYSICAL HEALTH |
|||||||||||