GALLUP NEWS SERVICE
PRINCETON, NJ -- The sour public mood that has led to decreases in ratings of the president, Congress, and overall national satisfaction is seemingly sparing no one affiliated with the Republican Party. The public's ratings of Vice President Dick Cheney and Defense Secretary Donald Rumsfeld have hit new lows. Americans' views of key Bush adviser Karl Rove have also been increasingly negative. Very few Democrats or independents have favorable impressions of Cheney, Rumsfeld, or Rove.
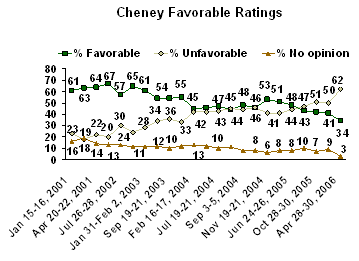
An April 28-30 USA Today/Gallup poll finds just 34% of Americans with a favorable opinion of Cheney. His previous low rating was 41% in December. Sixty-two percent now have an unfavorable opinion of the vice president.

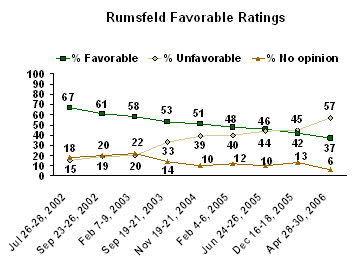
Rumsfeld's ratings are similarly negative -- 37% view him favorably and 57% unfavorably. His favorable rating has dropped five percentage points from its previous low in December, while his unfavorable rating has jumped 12 points during that time.

By comparison, George W. Bush's current favorable rating is 39% -- also the worst of his presidency. Sixty percent give Bush an unfavorable rating. Bush's favorable rating -- which is intended to measure respondents' basic opinions of him -- is slightly better than his approval rating (31%), which is designed to measure evaluations of his performance in office.
Both Cheney's and Rumsfeld's favorable ratings have followed courses similar to Bush's. Americans rallied behind their government in the wake of the Sept. 11 terrorist attacks, and as a result, government leaders received very positive ratings during that time. Cheney's favorable rating peaked at 67% in January 2002 and Rumsfeld's at 67% in July 2002 (the first time it was measured). Since then, ratings of both men have steadily declined, with both losing at least 30 points in their favorable ratings. Cheney's ratings turned more positive following the 2004 election, but began to decline again by the summer of 2005.
Cheney and Rumsfeld have thus far survived the recent White House shake-up, even though several retired military generals called for Rumsfeld's ouster. Rove was not as fortunate, having his duties as a national policy adviser taken away but still maintaining his role as a political adviser to Bush.
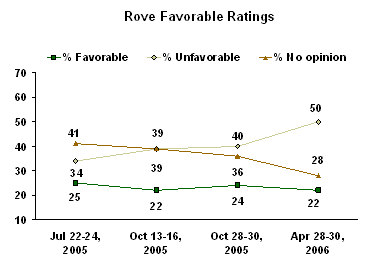
Rove's favorable ratings have never been particularly high -- in fact, his most positive score to date was 25% in July 2005 (compared with the current 22%). Initially, that was mostly due to a high proportion of Americans not having an opinion of him. But his negatives have steadily increased, from 34% in July 2005 to 50% now. Special prosecutors are still investigating Rove's involvement in leaks of classified information by the White House that led to the indictment of former Cheney aide I. Lewis "Scooter" Libby.

Republicans, naturally, give higher ratings to Cheney, Rumsfeld, Bush, and Rove than do Democrats or independents. At least 7 in 10 Republicans have favorable opinions of Bush (86%), Cheney (75%), and Rumsfeld (70%). However, relatively few independents or Democrats have positive views of these men. Fewer than one in five Democrats have favorable views of any of the four, and only as many as 27% of independents do.
|
Opinions of Cheney, Rumsfeld, Bush, and Rove, |
|||
|
Democrat |
Independent |
Republican |
|
|
% |
% |
% |
|
|
Cheney |
|
|
|
|
Favorable |
15 |
18 |
75 |
|
Unfavorable |
83 |
77 |
23 |
|
No opinion |
2 |
5 |
2 |
|
|
|
|
|
|
Rumsfeld |
|
|
|
|
Favorable |
17 |
27 |
70 |
|
Unfavorable |
78 |
65 |
25 |
|
No opinion |
4 |
8 |
5 |
|
|
|
|
|
|
Bush |
|
|
|
|
Favorable |
9 |
27 |
86 |
|
Unfavorable |
90 |
72 |
13 |
|
No opinion |
1 |
1 |
1 |
|
|
|
|
|
|
Rove |
|
|
|
|
Favorable |
9 |
14 |
46 |
|
Unfavorable |
63 |
60 |
23 |
|
No opinion |
28 |
26 |
32 |
Survey Methods
These results are based on telephone interviews with a randomly selected national sample of 1,011 national adults, aged 18 and older, conducted April 28-30, 2006. For results based on this sample, one can say with 95% confidence that the maximum error attributable to sampling and other random effects is ±3 percentage points. In addition to sampling error, question wording and practical difficulties in conducting surveys can introduce error or bias into the findings of public opinion polls.
6. Next, we'd like to get your overall opinion of some people in the news. As I read each name, please say if you have a favorable or unfavorable opinion of these people -- or if you have never heard of them. First, ... How about ... [ITEM A READ, THEN ITEMS B-D ROTATED, THEN ITEM E-F ROTATED]
A. George W. Bush
|
|
Favorable |
Unfavor- |
Never |
No |
|
% |
% |
% |
% |
|
|
2006 Apr 28-30 |
39 |
60 |
-- |
1 |
|
|
|
|
|
|
|
2005 Dec 16-18 |
46 |
53 |
-- |
1 |
|
2005 Jul 25-28 |
48 |
50 |
-- |
2 |
|
2005 Apr 1-2 |
54 |
45 |
-- |
1 |
|
2005 Feb 25-27 |
56 |
42 |
-- |
2 |
|
2005 Feb 4-6 |
59 |
39 |
-- |
2 |
|
2004 Nov 19-21 |
60 |
39 |
-- |
1 |
|
2004 Oct 29-31 |
51 |
46 |
-- |
3 |
|
2004 Oct 22-24 |
53 |
44 |
-- |
3 |
|
2004 Oct 14-16 |
55 |
44 |
-- |
1 |
|
2004 Oct 9-10 |
51 |
46 |
-- |
3 |
|
2004 Oct 1-3 |
53 |
45 |
-- |
2 |
|
2004 Sep 13-15 |
55 |
44 |
-- |
1 |
|
2004 Sep 3-5 |
55 |
44 |
-- |
1 |
|
2004 Aug 23-25 |
54 |
44 |
-- |
2 |
|
2004 Jul 30-Aug 1 |
52 |
46 |
-- |
2 |
|
2004 Jul 19-21 |
52 |
46 |
-- |
2 |
|
2004 Jul 8-11 |
52 |
46 |
-- |
2 |
|
2004 Jun 21-23 |
53 |
45 |
-- |
2 |
|
2004 Apr 16-18 |
56 |
42 |
-- |
2 |
|
2004 Mar 26-28 |
57 |
41 |
-- |
2 |
|
2004 Feb 16-17 |
56 |
42 |
-- |
2 |
|
2004 Jan 29-Feb 1 |
52 |
47 |
-- |
1 |
|
2004 Jan 2-5 |
65 |
35 |
-- |
* |
|
2003 Oct 6-8 |
60 |
39 |
-- |
1 |
|
2003 Jun 27-29 |
65 |
34 |
-- |
1 |
|
2003 Jun 9-10 |
66 |
33 |
-- |
1 |
|
2003 Jan 31-Feb 2 |
68 |
32 |
-- |
* |
|
2002 Dec 16-17 |
68 |
30 |
-- |
2 |
|
2002 Sep 23-26 |
70 |
28 |
-- |
2 |
|
2002 Jul 26-28 |
71 |
26 |
-- |
3 |
|
2002 May 20-22 |
80 |
18 |
-- |
2 |
|
2002 Apr 29-May 1 |
79 |
19 |
-- |
2 |
|
2002 Jan 11-14 |
83 |
15 |
-- |
2 |
|
2001 Nov 26-27 |
87 |
11 |
-- |
2 |
|
2001 Aug 3-5 |
60 |
35 |
1 |
4 |
|
2001 Jun 8-10 |
62 |
36 |
* |
2 |
|
2001 Apr 20-22 |
65 |
32 |
0 |
3 |
|
2001 Mar 9-11 |
63 |
32 |
0 |
5 |
|
2001 Mar 5-7 |
69 |
28 |
* |
3 |
|
2001 Feb 19-21 |
67 |
27 |
* |
6 |
|
2001 Feb 1-4 |
64 |
33 |
* |
3 |
|
2001 Jan 15-16 |
62 |
36 |
* |
2 |
|
2000 Dec 15-17 |
59 |
36 |
1 |
4 |
|
2000 Dec 2-4 |
56 |
40 |
* |
4 |
|
2000 Nov 13-15 |
53 |
43 |
* |
4 |
|
2000 Nov 4-5 † |
55 |
39 |
* |
6 |
|
2000 Oct 24-26 † |
62 |
33 |
* |
5 |
|
2000 Oct 23-25 † |
60 |
35 |
* |
5 |
|
2000 Oct 20-22 † |
59 |
37 |
* |
4 |
|
2000 Oct 5-7 † |
58 |
36 |
* |
6 |
|
2000 Sep 28-30 † |
55 |
38 |
0 |
7 |
|
2000 Sep 15-17† |
51 |
41 |
1 |
7 |
|
2000 Aug 18-19 |
60 |
34 |
* |
6 |
|
2000 Aug 4-5 |
67 |
28 |
* |
5 |
|
2000 Jul 25-26 |
63 |
31 |
* |
6 |
|
2000 Jul 14-16 |
64 |
29 |
* |
7 |
|
2000 Jun 23-25 |
60 |
31 |
0 |
9 |
|
2000 Jun 6-7 |
64 |
29 |
0 |
7 |
|
2000 Apr 28-30 |
61 |
33 |
* |
6 |
|
2000 Mar 10-12 |
63 |
32 |
* |
5 |
|
2000 Feb 25-27 |
57 |
35 |
1 |
7 |
|
2000 Feb 20-21 |
58 |
35 |
* |
7 |
|
2000 Feb 4-6 |
63 |
31 |
0 |
6 |
|
2000 Jan 17-19 |
66 |
26 |
* |
8 |
|
1999 Dec 9-12 |
68 |
25 |
1 |
6 |
|
1999 Oct 21-24 |
71 |
21 |
1 |
7 |
|
1999 Oct 8-10 |
70 |
25 |
1 |
4 |
|
1999 Sept 23-26 |
71 |
22 |
1 |
6 |
|
1999 Aug 16-18 |
68 |
21 |
1 |
10 |
|
1999 June 25-27 |
69 |
16 |
4 |
11 |
|
1999 Apr 13-14 |
73 |
15 |
3 |
9 |
|
1999 Feb 19-21 |
69 |
12 |
5 |
14 |
|
|
|
|
|
|
|
* Less than 0.5% |
||||
|
† Based on registered voters |
||||
B. Dick Cheney
|
|
Favorable |
Unfavor- |
Never |
No |
|
% |
% |
% |
% |
|
|
2006 Apr 28-30 |
34 |
62 |
1 |
2 |
|
|
|
|
|
|
|
2005 Dec 16-18 |
41 |
50 |
2 |
7 |
|
2005 Oct 28-30 |
42 |
51 |
2 |
5 |
|
2005 Oct 13-16 |
43 |
47 |
2 |
8 |
|
2005 Jun 24-26 |
48 |
44 |
2 |
6 |
|
2005 Feb 4-6 |
51 |
41 |
2 |
6 |
|
2004 Nov 19-21 |
53 |
41 |
2 |
4 |
|
2004 Oct 9-10 |
46 |
46 |
2 |
6 |
|
2004 Sep 3-5 |
48 |
44 |
2 |
6 |
|
2004 Aug 23-25 ^ |
44 |
45 |
2 |
9 |
|
2004 Jul 19-21 ^ |
47 |
43 |
2 |
8 |
|
2004 Jul 8-11 |
46 |
42 |
3 |
9 |
|
2004 Feb 16-17 |
45 |
42 |
3 |
10 |
|
2003 Oct 24-26 |
55 |
33 |
3 |
9 |
|
2003 Sep 19-21 |
54 |
36 |
3 |
7 |
|
2003 Jun 27-29 ^ |
54 |
34 |
3 |
9 |
|
2003 Jan 31-Feb 2 |
61 |
28 |
2 |
9 |
|
2002 Sep 23-26 |
65 |
24 |
4 |
7 |
|
2002 Jul 26-28 |
57 |
30 |
3 |
10 |
|
2002 Jan 11-14 |
67 |
20 |
3 |
10 |
|
2001 Apr 20-22 |
64 |
22 |
3 |
11 |
|
2001 Mar 5-7 |
63 |
18 |
5 |
14 |
|
2001 Jan 15-16 |
61 |
23 |
5 |
11 |
|
2000 Dec 15-17 |
61 |
23 |
6 |
10 |
|
2000 Dec 2-4 |
58 |
23 |
8 |
11 |
|
2000 Nov 13-15 |
51 |
22 |
9 |
18 |
|
2000 Nov 13-15 |
53 |
22 |
8 |
17 |
|
2000 Sep 15-17 |
46 |
24 |
8 |
22 |
|
2000 Aug 18-19 |
54 |
21 |
5 |
20 |
|
2000 Aug 4-5 |
48 |
21 |
9 |
22 |
|
2000 Jul 25-26 |
51 |
14 |
12 |
23 |
|
^ Asked of a half sample |
||||
C. Secretary of Defense, Donald Rumsfeld
|
|
Favorable |
Unfavor- |
Never |
No |
|
% |
% |
% |
% |
|
|
2006 Apr 28-30 |
37 |
57 |
2 |
4 |
|
|
|
|
|
|
|
2005 Dec 16-18 |
42 |
45 |
4 |
9 |
|
2005 Jun 24-26 |
46 |
44 |
5 |
5 |
|
2005 Feb 4-6 |
48 |
40 |
4 |
8 |
|
2004 Nov 19-21 |
51 |
39 |
5 |
5 |
|
2003 Sep 19-21 |
53 |
33 |
6 |
8 |
|
2003 Feb 7-9 |
58 |
20 |
10 |
12 |
|
2002 Sep 23-26 |
61 |
19 |
10 |
10 |
|
2002 Jul 26-28 |
67 |
15 |
9 |
9 |
D. Presidential adviser, Karl Rove
|
|
Favorable |
Unfavor- |
Never |
No opinion |
|
% |
% |
% |
% |
|
|
2006 Apr 28-30 |
22 |
50 |
16 |
12 |
|
|
|
|
|
|
|
2005 Oct 28-30 |
24 |
40 |
21 |
15 |
|
2005 Oct 13-16 |
22 |
39 |
23 |
16 |
|
2005 Jul 22-24 |
25 |
34 |
25 |
16 |