GALLUP NEWS SERVICE
PRINCETON, NJ -- Former Vice President and 2000 Democratic candidate for president Al Gore is enjoying positive reviews for his global warming documentary, An Inconvenient Truth. While Gore may be experiencing a bit of a comeback in terms of his perceived political viability, the American public's basic views of him are no more positive than they were four years ago, and remain below where they were when he was vice president. Gore's ratings differ significantly by partisanship, age, and race.
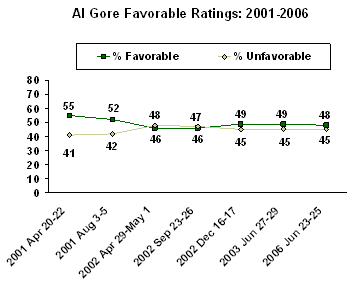
The June 23-25, 2006 poll finds 48% of Americans with a favorable opinion of Gore, while 45% have an unfavorable opinion. These results show little change from the last four times Gallup asked Americans to rate Gore in 2002 and 2003, suggesting that as of late June, there are no signs that Gore's high-visibility focus on global warming has produced changes in his standing among the American public.
More than half of Americans rated Gore favorably when he left the vice presidency in 2001. But, in the spring of 2002, Americans became much more divided in their views of Gore, and sentiments have remained this way ever since.

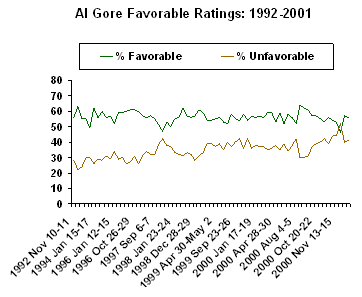
Gore's favorable ratings were consistently more positive than negative during his tenure as vice president, with the exception of one poll in December 2000, when he was contesting the results of that year's presidential election. From 1992 to 2001, Gore's average favorable rating was 56%, with a high of 64% following the 2000 Democratic National Convention, and a low of 46% in the aforementioned December 2000 survey.

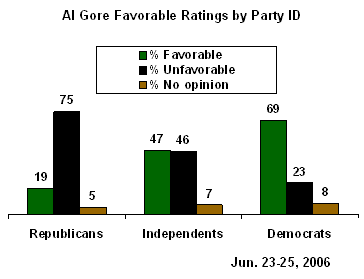
The latest poll finds significant differences between Republicans and Democrats in their opinions of Gore. Just 19% of Republicans have a favorable view of Gore, compared with 69% of Democrats. Independents are divided in their views, with 47% rating him favorably and 46% unfavorably.

Among various age groupings, Gore's ratings are most positive among younger Americans. Fifty-four percent of 18- to 34-year-olds and 52% of 35- to 49-year-olds rate the former vice president favorably, compared with 44% of 50- to 64-year-olds and only 38% of those aged 65 and older.
Men and women vary only slightly in the percentage viewing Gore favorably, at 45% and 50% respectively.
Nonwhites are much more favorable than whites in their opinion of Gore. Sixty-six percent of nonwhites rate Gore favorably, while among whites, a slightly larger percentage rates him unfavorably (49%) than favorably (42%).
As noted above, most Democrats have a positive view of Gore, which may explain why he continues to rank high in the minds of Democrats looking ahead to the 2008 presidential elections. In a recent USA Today/Gallup trial heat poll for the 2008 Democratic nomination, Gore ranked second behind Hillary Rodham Clinton as Democrats' preferred candidate for president in 2008. Additionally, a recent Gallup Panel poll finds that two in three Democrats (including independents leaning to the Democratic Party) find Gore an acceptable candidate for president in 2008. That placed Gore among the leaders along with Hillary Rodham Clinton and John Edwards.
Survey Methods
The latest results are based on telephone interviews with a randomly selected national sample of 1,000 adults, aged 18 and older, conducted June 23-25, 2006. For results based on this sample, one can say with 95% confidence that the maximum error attributable to sampling and other random effects is ±3 percentage points. In addition to sampling error, question wording and practical difficulties in conducting surveys can introduce error or bias into the findings of public opinion polls.
Here are four different plans the U.S. could follow in dealing with the war in Iraq. Which ONE do you prefer -- [ROTATED: withdraw all troops from Iraq immediately, withdraw all troops by August 2007 -- that is, in 12 months' time, withdraw troops, but take as many years to do this as are needed to turn control over to the Iraqis, (or) send more troops to Iraq]?
|
Favorable |
Unfavor- |
No |
|
|
% |
% |
% |
|
|
2006 |
|
|
|
|
2006 Jun 23-25 |
48 |
45 |
8 |
|
2003 |
|
|
|
|
2003 Jun 27-29 |
49 |
45 |
6 |
|
2002 |
|
|
|
|
2002 Dec 16-17 |
49 |
45 |
6 |
|
2002 Sep 23-26 |
46 |
47 |
7 |
|
2002 Apr 29-May 1 |
46 |
48 |
6 |
|
2001 |
|
|
|
|
2001 Aug 3-5 |
52 |
42 |
6 |
|
2001 Apr 20-22 |
55 |
41 |
4 |
|
2001 Jan 15-16 |
56 |
41 |
3 |
|
2000 |
|
|
|
|
2000 Dec 15-17 |
57 |
40 |
3 |
|
2000 Dec 2-4 |
46 |
52 |
2 |
|
2000 Nov 13-15 |
53 |
44 |
3 |
|
2000 Nov 13-15 † |
54 |
44 |
2 |
|
2000 Nov 4-5 † |
56 |
39 |
5 |
|
2000 Oct 24-26 † |
53 |
42 |
5 |
|
2000 Oct 23-25 † |
55 |
40 |
5 |
|
2000 Oct 20-22 † |
57 |
39 |
4 |
|
2000 Oct 5-7 † |
57 |
37 |
6 |
|
2000 Sep 28-30 † |
61 |
31 |
8 |
|
2000 Sep 15-17 † |
62 |
30 |
8 |
|
2000 Aug 18-19 |
64 |
30 |
6 |
|
2000 Aug 4-5 |
52 |
42 |
6 |
|
2000 Jul 25-26 |
56 |
38 |
6 |
|
2000 Jul 14-16 |
58 |
34 |
8 |
|
2000 Jun 23-25 |
52 |
39 |
9 |
|
2000 Jun 6-7 |
59 |
35 |
6 |
|
2000 Apr 28-30 |
53 |
38 |
9 |
|
2000 Mar 10-12 |
59 |
36 |
5 |
|
2000 Feb 25-27 |
59 |
35 |
6 |
|
2000 Feb 20-21 |
56 |
37 |
7 |
|
2000 Feb 4-6 |
57 |
37 |
6 |
|
2000 Jan 17-19 |
56 |
38 |
6 |
|
1999 |
|
|
|
|
1999 Dec 20-21 |
57 |
36 |
7 |
|
1999 Dec 9-12 |
54 |
42 |
4 |
|
1999 Oct 21-24 |
58 |
36 |
6 |
|
1999 Oct 8-10 |
54 |
42 |
4 |
|
1999 Sep 23-26 |
55 |
40 |
5 |
|
1999 Aug 16-18 |
58 |
37 |
5 |
|
1999 Aug 3-4 |
52 |
40 |
8 |
|
1999 Jul 22-25 |
53 |
35 |
12 |
|
1999 Jun 25-27 |
56 |
39 |
5 |
|
1999 Apr 30-May 2 |
55 |
37 |
8 |
|
1999 Apr 13-14 |
54 |
39 |
7 |
|
1999 Apr 13-14 |
54 |
39 |
7 |
|
1999 Feb 19-21 |
59 |
33 |
8 |
|
1999 Feb 4-8 |
61 |
31 |
8 |
|
1998 |
|
|
|
|
1998 Dec 28-29 |
57 |
28 |
15 |
|
1998 Sep 14-15 |
56 |
32 |
12 |
|
1998 Feb 13-15 |
57 |
33 |
10 |
|
1998 Jan 30-Feb 1 |
62 |
31 |
7 |
|
1998 Jan 24-25 |
56 |
32 |
12 |
|
1998 Jan 23-24 |
55 |
33 |
12 |
|
1997 |
|
|
|
|
1997 Dec 18-21 |
50 |
37 |
13 |
|
1997 Oct 27-29 |
53 |
38 |
9 |
|
1997 Oct 3-5 |
47 |
42 |
11 |
|
1997 Sep 25-28 |
51 |
39 |
10 |
|
1997 Sep 6-7 |
55 |
32 |
13 |
|
1997 Jun 26-29 |
57 |
32 |
10 |
|
1997 Apr 18-20 |
56 |
34 |
10 |
|
1997 Mar 24-26 |
57 |
31 |
12 |
|
1997 Jan 3-5 |
60 |
26 |
14 |
|
1996 |
|
|
|
|
1996 Oct 26-29 |
61 |
31 |
8 |
|
1996 Aug 30- Sep 1 † |
61 |
27 |
12 |
|
1996 Aug 28-29 † |
60 |
26 |
14 |
|
1996 16-18 † |
59 |
30 |
11 |
|
1996 Aug 11 † |
59 |
29 |
12 |
|
1996 Jan 12-15 |
52 |
34 |
14 |
|
1995 |
|
|
|
|
1995 Jan 16-18 |
57 |
29 |
14 |
|
1994 |
|
|
|
|
1994 Sep 6-7 |
56 |
31 |
13 |
|
1994 Apr 22-24 |
60 |
28 |
12 |
|
1994Mar 25-27 |
56 |
29 |
15 |
|
1994 Jan 15-17 |
62 |
26 |
12 |
|
1993 |
|
|
|
|
1993 Nov 2-4 |
49 |
30 |
21 |
|
1993 Jul 19-21 |
55 |
30 |
15 |
|
1993 Apr 22-24 |
55 |
24 |
21 |
|
1993 Jan 18-19 |
63 |
22 |
15 |
|
1992 |
|
|
|
|
1992 Nov 10-11 |
56 |
28 |
16 |
|
^ Asked of a half sample |
|||
|
† Based on registered voters |
|||