GALLUP NEWS SERVICE
PRINCETON, NJ - An analysis of CNN/USA Today/Gallup Poll tracking data from September 4 to October 18 indicates that Republican nominee George W. Bush has improved his position vis à vis Democratic nominee Al Gore in the period since October 4 (the day after the first debate) compared to the weeks before the first debate.
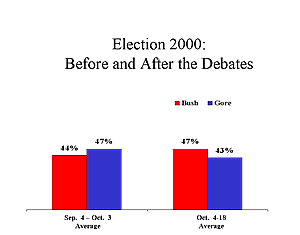
The first presidential debate was held in Boston on October 3, with the second in Winston-Salem, North Carolina on October 11, and the final debate in St. Louis on October 17. The chart below shows the average percentage of the vote for both Bush and Gore over the 30 days between September 4 and October 3, contrasted to the percentage of the vote for both candidates over the 15 days from October 4 to October 18. All data are based on likely voters, including approximately 7,700 interviews between September 4 and October 3, and 3,500 interviews between October 4 and October 18.

Gore's average percentage of the vote was 47% in the 30 days before the debates (including the night of October 3) and has been 43% in the 15 days since. Bush's percentage of the vote went from 44% to 47% over the same period of time.
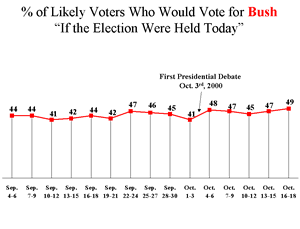
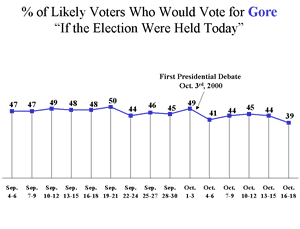
Here are the more specific data for each candidate:


On a day-by-day level, a roughly similar pattern occurred in and around each debate. Bush improved his position in the days after each debate, but fell back relative to Gore as the week before the second and third debate began.
Gore's 40% of the vote in the October 18-20 tracking poll is roughly where he was in the period immediately after the first debate. Bush's current 51% is slightly higher than his position during that same period of time. There are, of course, no more debates, so one important trend to follow will be the extent to which Bush maintains his lead going into next week, as opposed to the tightening pattern we have seen following the first two debates.
Survey Methods
Latest results are based on telephone interviews with -- 1,201 --
national adults, aged 18+, conducted October 18-20, 2000. For
results based on the total sample of national adults, one can say
with 95% confidence that the margin of sampling error is +/- 3
percentage points.
Results based on likely voters are based on the subsample of -- 718 -- survey respondents deemed most likely to vote in the November 2000 general election, according to a series of questions measuring current voting intentions and past voting behavior. For results based on the total sample of likely voters, one can say with 95% confidence that the margin of sampling error is +/- 4 percentage points.