GALLUP NEWS SERVICE
PRINCETON, NJ -- Gallup's annual Health and Healthcare poll finds little change in Americans' assessment of their physical and mental health over the past several years, with roughly 8 in 10 Americans describing each area of their health as excellent or good. Some of the groups with more dour assessments of their physical and mental health include senior citizens, those residing in lower income households, blacks, and Democrats. With an overall average of four days of suffering from poor physical health and three days of suffering from poor mental health per month, most Americans report they have not experienced any days in the past month of poor physical or mental health.
Americans' Physical Health Ratings
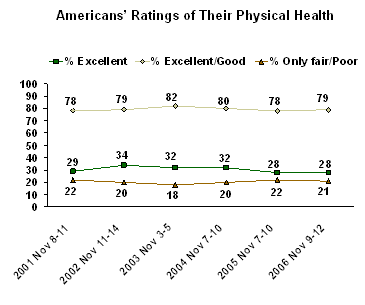
The Nov. 9-12, 2006 poll finds that most Americans describe their physical health as excellent or good, with roughly one in four saying their health is excellent at this time. Only about one in five describe their health as only fair or poor at the present time.
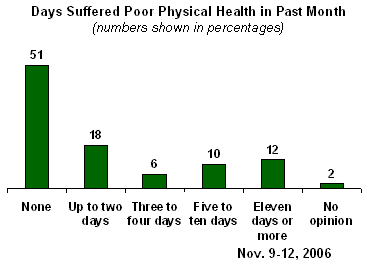
On average, Americans report experiencing four days during the past month where their physical health was not good. The mean of four days is high because a significant number of Americans report a large number of bad health days, including 12% who suffered 11 or more days, and 10% who felt ill for 5 to 10 days. A majority of Americans, 51%, did not experience any days of poor physical health in the last month.
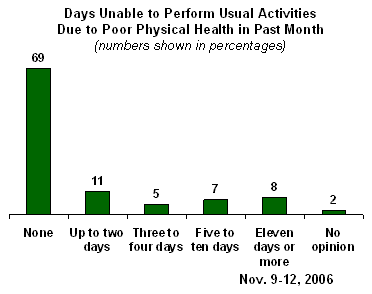
Poor physical health has kept Americans from their usual activities -- such as self-care, work, and recreation -- an average of three days over the past month. Again, this was not the typical experience, as 69% of Americans report that poor health did not affect their usual activities at all. Eleven percent report it kept them from their usual activities one or two days, 5% for three or four days, and 15% for five days or more.
Among those who experienced poor physical health in the past month, the average number of days respondents have been unable to perform their usual activities is six days, with 39% saying they have been kept from their usual activities for no days, 21% for one or two days, 10% for three or four days, and 30% for five days or more.
Gallup has found only modest variation in Americans' assessment of their physical health since first asking these questions in 2001.
Americans Rate Their Mental Health
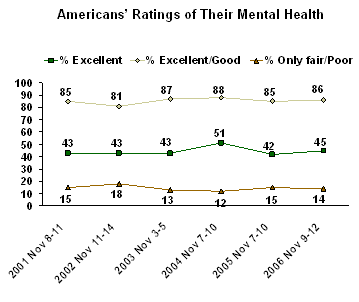
More than 8 in 10 Americans describe their mental health as excellent or good, with slightly fewer than half (45%) saying their mental health is excellent. Just about one in six describe it as only fair (11%) or poor (3%). These results have only shown modest fluctuation since Gallup first asked this question in 2001, ranging from a low of 81% positive ratings to a high of 88% over this time period.
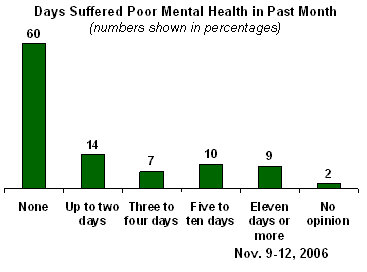
On average, Americans tell Gallup that in the last month they have experienced three days where their mental health or emotional well-being was not good. Sixty percent of Americans experienced no such days, 21% had up to four poor mental health days, and 19% had five or more days.
While reporting an average of three poor mental health days in the past month, Americans only averaged 1.6 days where their poor mental health or emotional well-being kept them from doing their usual activities. The vast majority -- 80% -- had no days in the past month in which their mental well-being kept them from their normal routines. Eight percent had up to four such days, and 9% had five days or more.
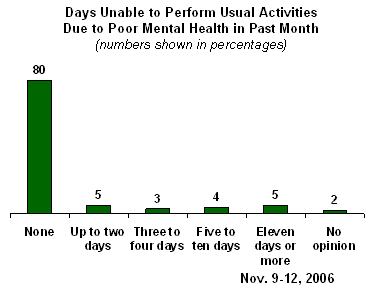
The smaller group of respondents who have experienced poor mental health in the past month report an average of 4.2 days in which their mental health prevented them from doing their normal activities.
Physical and Mental Health Ratings by Demographic Groups
Since Americans' overall ratings of their physical and mental health have remained stable over the past several years, Gallup combined the results of its past four surveys, from 2003 through 2006, to better understand which groups of Americans more positively assess their physical and mental health.
The aggregated results show that a majority of all Americans describe both their physical and mental health as excellent or good. But, there are some variations in health ratings by the percentage rating their physical and mental health as excellent.
Here are the results of Americans' ratings of their physical health:
|
Physical Health Ratings by Demographic Groups |
|||
|
|
Excellent/ |
Only fair/ |
|
|
% |
% |
% |
|
|
18- to 29-year-olds |
41 |
88 |
12 |
|
30- to 49-year-olds |
33 |
85 |
15 |
|
50- to 64-year-olds |
26 |
76 |
24 |
|
65 years and older |
17 |
64 |
36 |
|
|
|
|
|
|
Men |
31 |
81 |
18 |
|
Women |
29 |
78 |
22 |
|
|
|
|
|
|
Men, aged 18 to 49 |
37 |
87 |
13 |
|
Men, aged 50 and older |
21 |
73 |
27 |
|
Women, aged 18 to 49 |
34 |
85 |
15 |
|
Women, aged 50 and older |
23 |
69 |
31 |
|
|
|
|
|
|
Less than $30,000 per year |
19 |
65 |
35 |
|
$30,000 to $74,999 per year |
30 |
82 |
18 |
|
$75,000 or more per year |
43 |
92 |
8 |
|
|
|
|
|
|
Whites |
31 |
81 |
19 |
|
Blacks |
19 |
66 |
34 |
|
|
|
|
|
|
Republicans |
35 |
87 |
13 |
|
Independents |
28 |
78 |
22 |
|
Democrats |
27 |
75 |
25 |
|
|
|
|
|
|
Weekly/almost weekly churchgoer |
30 |
80 |
20 |
|
Monthly churchgoer |
34 |
81 |
19 |
|
Seldom/never go to church |
29 |
79 |
21 |
- Men and women show only slight differences in their ratings of their physical health, with roughly 3 in 10 in each group describing their health as excellent.
- Younger adults are much more likely than those who are older to rate their health positively. Forty-one percent of 18- to 29-year-olds rate their health as excellent, compared with 33% of 30- to 49-year-olds, 26% of 50- to 64-year-olds, and just 17% of senior citizens.
- Only 19% of Americans residing in households earning less than $30,000 per year rate their health as excellent; considerably lower than the 30% rating for those earning between $30,000 and $75,000 per year, and the 43% rating for those earning $75,000 or more per year.
- Thirty-one percent of whites describe their health as excellent at the present time, compared with 19% of blacks.
- Republicans (35%) are slightly more likely than independents (28%) or Democrats (27%) to rate their health as excellent. This may be due, at least in part, to age and income differences between Republicans and Democrats.
The aggregated results also show some variations in ratings of mental health among different groups of Americans, although these differences are not as great as those for physical health ratings:
|
Mental Health Ratings by Demographic Groups |
|||
|
|
Excellent/ |
Only fair/ |
|
|
|
|
|
|
|
18- to 29-year-olds |
48 |
84 |
16 |
|
30- to 49-year-olds |
48 |
88 |
12 |
|
50- to 64-year-olds |
45 |
87 |
13 |
|
65 years and older |
39 |
86 |
14 |
|
|
|
|
|
|
Men |
48 |
89 |
11 |
|
Women |
43 |
84 |
16 |
|
|
|
|
|
|
Men, aged 18 to 49 |
50 |
90 |
10 |
|
Men, aged 50 and older |
45 |
88 |
12 |
|
Women, aged 18 to 49 |
45 |
83 |
17 |
|
Women, aged 50 and older |
41 |
85 |
15 |
|
|
|
|
|
|
Less than $30,000 per year |
32 |
78 |
22 |
|
$30,000 to $74,999 per year |
47 |
89 |
11 |
|
$75,000 or more per year |
58 |
94 |
6 |
|
|
|
|
|
|
Whites |
47 |
87 |
13 |
|
Blacks |
33 |
81 |
19 |
|
|
|
|
|
|
Republicans |
58 |
92 |
8 |
|
Independents |
41 |
83 |
16 |
|
Democrats |
37 |
84 |
15 |
|
|
|
|
|
|
Weekly/almost weekly churchgoer |
51 |
90 |
10 |
|
Monthly churchgoer |
45 |
86 |
14 |
|
Seldom/never go to church |
40 |
84 |
16 |
- Men and women vary only slightly in their ratings of mental health.
- Senior citizens are less likely than younger adults to describe their mental health as excellent -- nearly half of adults under age 50 say their mental health is excellent, compared with 45% of those aged 50 to 64, and just 39% of those aged 65 and older.
- Just about a third of adults in the low income category describe their mental health as excellent. This sentiment is much higher among those earning more, at 47% in the middle income group, and at 58% in the high income category.
- Whites (47%) are much more likely than blacks (33%) to describe their mental health as excellent.
- Ratings of mental health also vary by partisanship, with a majority of Republicans (58%) describing their mental health as excellent, and only 41% of independents and 37% of Democrats describing their emotional well-being in this way.
- Americans who attend church weekly or almost weekly (50%) are more positive in their ratings of mental health than those who attend monthly (45%) or who seldom or never attend services (40%).
Survey Methods
Results are based on telephone interviews with 1,004 national adults, aged 18 and older, conducted Nov. 9-12, 2006. For results based on the total sample of national adults, one can say with 95% confidence that the maximum margin of sampling error is ±3 percentage points.
For results based on the sample of 450 adults who experienced at least one day of poor physical health in the past month, the maximum margin of sampling error is ±5 percentage points.
For results based on the sample of 340 adults who experienced at least one day of poor mental health in the past month, the maximum margin of sampling error is ±6 percentage points.
In addition to sampling error, question wording and practical difficulties in conducting surveys can introduce error or bias into the findings of public opinion polls.
11. How would you describe your own physical health at this time? Would you say your physical health is -- excellent, good, only fair, or poor?
|
Excellent |
Good |
Only |
Poor |
No |
|
|
% |
% |
% |
% |
% |
|
|
2006 Nov 9-12 |
28 |
51 |
16 |
5 |
-- |
|
|
|
|
|
|
|
|
2005 Nov 7-10 |
28 |
50 |
18 |
4 |
* |
|
2004 Nov 7-10 |
32 |
48 |
14 |
6 |
* |
|
2003 Nov 3-5 |
32 |
50 |
14 |
4 |
* |
|
2002 Nov 11-14 |
34 |
45 |
14 |
6 |
1 |
|
2001 Nov 8-11 |
29 |
49 |
17 |
5 |
* |
|
* = Less than 0.5% |
|||||
12. Now, thinking about your physical health, for how many days during the past month was your physical health not good? [Open-ended]
|
|
Less |
|
|
|
|
|
|
No |
|
|
|
|
% |
% |
% |
% |
% |
% |
% |
% |
% |
|
|
|
|
2006 Nov 9-12 |
51 |
1 |
7 |
10 |
4 |
2 |
10 |
12 |
2 |
4.2 |
0 |
|
|
|
|
|
|
|
|
|
|
|
|
|
|
2005 Nov 7-10 |
53 |
* |
9 |
7 |
5 |
2 |
11 |
10 |
3 |
3.6 |
0 |
|
2004 Nov 7-10 |
56 |
* |
9 |
8 |
3 |
2 |
9 |
12 |
1 |
4.0 |
0 |
|
2003 Nov 3-5 |
54 |
1 |
7 |
9 |
6 |
3 |
8 |
10 |
1 |
3.4 |
0 |
|
2002 Nov 11-14 |
54 |
1 |
7 |
9 |
5 |
2 |
9 |
10 |
3 |
3.5 |
0 |
|
2001 Nov 8-11 |
52 |
* |
7 |
9 |
4 |
3 |
11 |
12 |
2 |
4.0 |
0 |
|
* = Less than .5% |
|||||||||||
13. During the past month, for about how many days did poor physical health keep you from doing your usual activities, such as self-care, work, or recreation? [Open-ended]
|
|
|
Less |
|
|
|
|
|
|
|
|
|
|
% |
% |
% |
% |
% |
% |
% |
% |
% |
|
|
|
|
National Adults |
|
|
|
|
|
|
|
|
|
|
|
|
2006 Nov 9-12 |
69 |
1 |
4 |
6 |
4 |
1 |
7 |
8 |
2 |
2.7 |
0 |
|
2005 Nov 7-10 |
73 |
* |
5 |
4 |
4 |
1 |
5 |
6 |
2 |
1.8 |
0 |
|
2004 Nov 7-10 |
71 |
-- |
7 |
4 |
2 |
1 |
5 |
8 |
2 |
2.6 |
0 |
|
2003 Nov 3-5 |
74 |
* |
5 |
4 |
2 |
1 |
5 |
6 |
2 |
2.0 |
0 |
|
2002 Nov 11-14 |
72 |
* |
5 |
4 |
3 |
1 |
5 |
7 |
3 |
2.4 |
0 |
|
2001 Nov 8-11 |
73 |
* |
5 |
4 |
3 |
2 |
6 |
7 |
* |
2.3 |
0 |
|
|
|
|
|
|
|
|
|
|
|
|
|
|
Experienced |
|
|
|
|
|
|
|
|
|
|
|
|
2006 Nov 9-12 |
39 |
1 |
8 |
12 |
8 |
2 |
14 |
16 |
1 |
5.7 |
2 |
|
2005 Nov 7-10 |
46 |
* |
10 |
10 |
9 |
3 |
10 |
11 |
1 |
4.0 |
1 |
|
2004 Nov 7-10 |
34 |
-- |
16 |
10 |
5 |
3 |
12 |
19 |
1 |
6.1 |
1 |
|
2003 Nov 3-5 |
43 |
* |
12 |
10 |
5 |
3 |
12 |
13 |
2 |
4.4 |
1 |
|
2002 Nov 11-14 |
41 |
1 |
11 |
9 |
6 |
2 |
12 |
17 |
1 |
5.3 |
1 |
|
2001 Nov 8-11 |
43 |
* |
10 |
8 |
7 |
3 |
14 |
14 |
* |
5.0 |
1 |
|
* = Less than 0.5% |
|||||||||||
|
^ BASED ON 450 WHO EXPERIENCED DAY(S) OF POOR PHYSICAL HEALTH |
|||||||||||
14. How would you describe your own mental health or emotional well-being at this time? Would you say it is -- excellent, good, only fair, or poor?
|
Excellent |
Good |
Only |
Poor |
No |
|
|
% |
% |
% |
% |
% |
|
|
2006 Nov 9-12 |
45 |
41 |
11 |
3 |
* |
|
|
|
|
|
|
|
|
2005 Nov 7-10 |
42 |
43 |
13 |
2 |
* |
|
2004 Nov 7-10 |
51 |
37 |
9 |
3 |
-- |
|
2003 Nov 3-5 |
43 |
44 |
11 |
2 |
* |
|
2002 Nov 11-14 |
43 |
38 |
15 |
3 |
1 |
|
2001 Nov 8-11 |
43 |
42 |
12 |
3 |
* |
15. Now, thinking about your mental health or emotional well being, for how many days during the past month was either of these not good? [Open-ended]
|
|
Less |
|
|
|
|
|
|
|
|
|
|
|
% |
% |
% |
% |
% |
% |
% |
% |
% |
|
|
|
|
2006 Nov 9-12 |
60 |
1 |
4 |
9 |
5 |
2 |
10 |
9 |
2 |
2.9 |
0 |
|
|
|
|
|
|
|
|
|
|
|
|
|
|
2005 Nov 7-10 |
60 |
1 |
4 |
6 |
5 |
2 |
11 |
9 |
2 |
3.0 |
0 |
|
2004 Nov 7-10 |
65 |
* |
7 |
6 |
3 |
1 |
8 |
9 |
1 |
2.9 |
0 |
|
2003 Nov 3-5 |
64 |
* |
4 |
7 |
6 |
2 |
8 |
7 |
2 |
2.4 |
0 |
|
2002 Nov 11-14 |
61 |
1 |
5 |
7 |
4 |
2 |
9 |
8 |
3 |
2.6 |
0 |
|
2001 Nov 8-11 |
62 |
* |
5 |
8 |
4 |
2 |
9 |
8 |
2 |
2.7 |
0 |
|
* = Less than 0.5% |
|||||||||||
16. During the past month, for about how many days did poor mental health or emotional well-being keep you from doing your usual activities, such as self-care, work or recreation? [Open-ended]
|
|
Less |
|
|
|
|
|
|
No |
|
|
|
|
% |
% |
% |
% |
% |
% |
% |
% |
% |
|
|
|
|
National |
|
|
|
|
|
|
|
|
|
|
|
|
2006 Nov 9-12 |
80 |
* |
2 |
3 |
2 |
1 |
4 |
5 |
2 |
1.6 |
0 |
|
2005 Nov 7-10 |
83 |
* |
2 |
2 |
2 |
* |
5 |
4 |
2 |
1.3 |
0 |
|
2004 Nov 7-10 |
83 |
-- |
3 |
2 |
1 |
* |
5 |
5 |
1 |
1.7 |
0 |
|
2003 Nov 3-5 |
85 |
* |
2 |
1 |
2 |
* |
3 |
4 |
2 |
1.0 |
0 |
|
2002 Nov 11-14 |
82 |
* |
3 |
1 |
1 |
1 |
5 |
4 |
3 |
1.5 |
0 |
|
2001 Nov 8-11 |
85 |
* |
3 |
2 |
1 |
1 |
4 |
4 |
* |
1.3 |
0 |
|
|
|
|
|
|
|
|
|
|
|
|
|
|
Experienced Poor |
|
|
|
|
|
|
|
|
|
|
|
|
2006 Nov 9-12 |
53 |
* |
5 |
8 |
6 |
3 |
11 |
13 |
1 |
4.2 |
0 |
|
2005 Nov 7-10 |
61 |
* |
6 |
6 |
4 |
* |
12 |
11 |
* |
3.3 |
0 |
|
2004 Nov 7-10 |
54 |
-- |
8 |
5 |
3 |
1 |
14 |
15 |
-- |
4.9 |
0 |
|
2003 Nov 3-5 |
62 |
1 |
6 |
4 |
6 |
1 |
9 |
11 |
1 |
2.9 |
0 |
|
2002 Nov 11-14 |
57 |
* |
7 |
4 |
4 |
2 |
13 |
12 |
1 |
4.0 |
0 |
|
2001 Nov 8-11 |
58 |
* |
7 |
5 |
4 |
2 |
11 |
12 |
1 |
3.7 |
0 |
|
* = Less than 0.5% |
|||||||||||
|
^ BASED ON 340 WHO EXPERIENCED DAY(S) OF POOR MENTAL HEALTH |
|||||||||||