GALLUP NEWS SERVICE
PRINCETON, NJ -- Americans remain highly confident that the food they get at most grocery stores and restaurants is safe to eat, even after recent incidents of E. coli bacteria found in fresh spinach at stores and at Taco Bell restaurants in certain areas of the country. More Americans now say they are paying attention to food warnings and nutritional recommendations they hear or read about than said so three years ago. The vast majority of Americans continue to express at least a fair amount of confidence in the federal government to ensure the safety of the U.S. food supply.
Food Safety
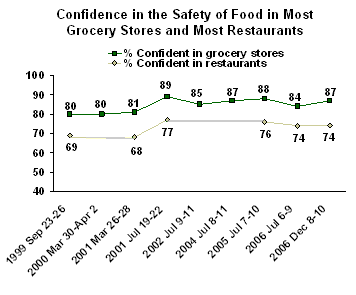
The Dec. 8-10 poll finds a high level of confidence in both the food available at restaurants and at groceries. Eighty-seven percent of Americans say they are confident that the food available at "most grocery stores" is safe to eat, and 74% say the same about the food at "most restaurants." These percentages have varied little in recent years, though they are somewhat higher than Gallup observed from 1999 to 2001. Americans have always been more confident in the safety of food at grocery stores than in the safety of food at restaurants.

This measure may not be that sensitive to change following reports of food illnesses from isolated parts of the country or at a single restaurant or grocery store chain, because it asks about safety at most restaurants and most grocery stores. Still, the lack of change in these measures suggests that the recent events are not causing Americans to panic.
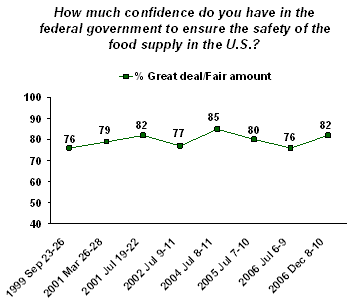
Eighty-two percent of Americans have at least a fair amount of confidence in the federal government to ensure the safety of the food supply, including 22% who have a great deal of confidence. The level of confidence has varied little over the past eight years.

Messages Received?
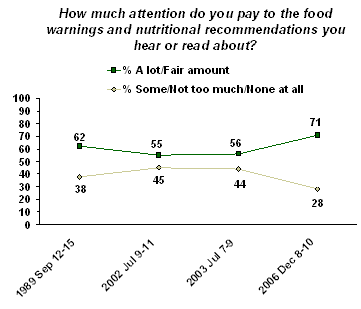
A higher percentage of Americans report paying attention to food warnings and nutritional recommendations they read and hear about than Gallup has found in recent years. Seventy-one percent of Americans say they pay "a lot" (33%) or "a fair amount" (38%) of attention to these things. When last asked in 2003, only 56% said they paid that much attention. Because of the time between the last two measurements, it is unclear whether the recent spinach and Taco Bell cases have contributed to the increase. The increase may just reflect a generally increasing emphasis on nutrition and food ingredients in the popular media.

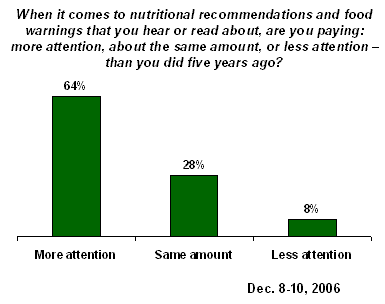
Additionally, most Americans say they, personally, are paying more attention to nutritional recommendations and food warnings than they did five years ago. Twenty-eight percent say they are paying the same amount of attention, and 8% say they are paying less.

Women are more likely than men to say they pay attention to news about food, by an 81% to 61% margin, and also to say they are paying more attention now than five years ago (71% to 56%).
Some evidence to support the notion that nutritional recommendations and warnings are getting through comes from the finding that a majority of Americans say they actively try to avoid trans fats and sugar in their diets. The city of New York recently banned the use of trans fats in all its restaurants. Nearly half of Americans say they try to avoid salt. At the same time, at least 7 in 10 Americans say they actively try to include vegetables, dairy products, and fish.
Thinking about the food you eat, for each of the following please say if it is something you actively try to include in your diet, something you actively try to avoid, or something you don't think about either way. How about -- [RANDOM ORDER]?
|
|
|
Don't think |
|
|
% |
% |
% |
|
|
Vegetables |
91 |
2 |
7 |
|
Dairy products |
71 |
10 |
18 |
|
Fish and other seafood |
70 |
11 |
19 |
|
Beef and other red meat |
60 |
18 |
21 |
|
Carbohydrates |
38 |
25 |
36 |
|
Salt |
24 |
49 |
27 |
|
Sugar |
22 |
51 |
27 |
|
Trans fats |
5 |
64 |
30 |
There has been an increase in the percentage of Americans who say they are avoiding sugar compared with 2002 (from 43% to 51%), and a more modest increase in the percentage avoiding salt (from 45% to 49%).
Survey Methods
These results are based on telephone interviews with a randomly selected national sample of 1,004 adults, aged 18 and older, conducted Dec. 8-10, 2006. For results based on this sample, one can say with 95% confidence that the maximum error attributable to sampling and other random effects is ±3 percentage points. In addition to sampling error, question wording and practical difficulties in conducting surveys can introduce error or bias into the findings of public opinion polls.On a different topic,
Q.21-22 SPLIT SAMPLED
21. How much attention do you pay to the food warnings and nutritional recommendations you hear or read about? Do you pay -- a lot of attention, a fair amount, some, not too much, or none at all?
BASED ON 505 NATIONAL ADULTS IN FORM A
|
|
|
Fair amount |
|
Not too much |
None |
No opinion |
|
% |
% |
% |
% |
% |
% |
|
|
2006 Dec 8-10 ^ |
33 |
38 |
15 |
9 |
4 |
-- |
|
|
|
|
|
|
|
|
|
2003 Jul 7-9 |
23 |
33 |
23 |
12 |
9 |
* |
|
2002 Jul 9-11 |
22 |
33 |
21 |
16 |
8 |
* |
|
1989 Sep 12-15 |
26 |
36 |
16 |
13 |
9 |
* |
|
|
|
|
|
|
|
|
|
^Asked of a half sample |
||||||
22. When it comes to nutritional recommendations and food warnings that you hear or read about, are you paying -- [ROTATED: more attention, about the same amount, or less attention] – than you did five years ago?
BASED ON 504 NATIONAL ADULTS IN FORM B
|
|
More |
Same |
Less |
No |
|
|
|
|
|
|
|
2006 Dec 8-10 |
64% |
28 |
8 |
* |
Q.23-24 ROTATED
23. Do you feel confident or not confident that the food available at most grocery stores is safe to eat?
|
Confident |
Not confident |
No opinion |
|
|
% |
% |
% |
|
|
2006 Dec 8-10 |
87 |
12 |
1 |
|
|
|
|
|
|
2006 Jul 6-9 |
84 |
15 |
1 |
|
2005 Jul 7-10 |
88 |
12 |
* |
|
2004 Jul 8-11 |
87 |
12 |
1 |
|
2002 Jul 9-11 |
85 |
13 |
2 |
|
2001 Jul 19-22 |
89 |
10 |
1 |
|
2001 Mar 26-28 |
81 |
18 |
1 |
|
2000 Mar 30-Apr 2 |
80 |
18 |
2 |
|
1999 Sep 23-26 |
80 |
19 |
1 |
24. Do you feel confident or not confident that the food served at most restaurants is safe to eat?
|
Confident |
Not confident |
No opinion |
|
|
% |
% |
% |
|
|
2006 Dec 8-10 |
74 |
24 |
2 |
|
|
|
|
|
|
2006 Jul 6-9 |
74 |
24 |
2 |
|
2005 Jul 7-10 |
76 |
23 |
1 |
|
2001 Jul 19-22 |
77 |
21 |
2 |
|
2001 Mar 26-28 |
68 |
29 |
3 |
|
1999 Sep 23-26 |
69 |
30 |
1 |
25. How much confidence do you have in the federal government to ensure the safety of the food supply in the U.S., would you say you have -- a great deal, a fair amount, not much, or none at all?
|
|
A great |
A fair |
|
|
No |
|
% |
% |
% |
% |
% |
|
|
2006 Dec 8-10 |
22 |
60 |
15 |
3 |
* |
|
|
|
|
|
|
|
|
2006 Jul 6-9 |
22 |
54 |
18 |
6 |
* |
|
2005 Jul 7-10 |
19 |
61 |
15 |
5 |
* |
|
2004 Jul 8-11 |
31 |
54 |
11 |
3 |
1 |
|
2002 Jul 9-11 |
19 |
58 |
16 |
6 |
1 |
|
2001 Jul 19-22 |
21 |
61 |
13 |
4 |
1 |
|
2001 Mar 26-28 |
25 |
54 |
17 |
3 |
1 |
|
1999 Sep 23-26 |
15 |
61 |
19 |
5 |
* |
26. How often, if ever, do you eat at fast food restaurants, including drive-thru, take-out, and sitting down in the restaurant -- every day, several times a week, about once a week, once or twice a month, a few times a year, or never?
|
|
Several times |
About once a week |
Once or twice a month |
A few times |
|
|
|
|
|
|
|
|
|
|
|
|
|
2006 Dec 8-10 |
3% |
20 |
33 |
25 |
15 |
4 |
* |
|
|
|
|
|
|
|
|
|
|
2003 Jul 7-9 |
4% |
17 |
31 |
30 |
13 |
5 |
* |
27. Thinking about the food you eat, for each of the following please say if it is something you actively try to include in your diet, something you actively try to avoid, or something you don't think about either way. How about -- [RANDOM ORDER]?
A. Beef and other red meat
|
|
|
Don't |
No |
|
|
% |
% |
% |
% |
|
|
2006 Dec 8-10 |
60 |
18 |
21 |
1 |
|
|
|
|
|
|
|
2004 Jul 8-11 |
59 |
20 |
21 |
* |
|
2002 Jul 9-11 |
60 |
23 |
17 |
* |
B. Carbohydrates
|
|
|
Don't |
No |
|
|
% |
% |
% |
% |
|
|
2006 Dec 8-10 |
38 |
25 |
36 |
1 |
|
|
|
|
|
|
|
2004 Jul 8-11 |
33 |
27 |
39 |
1 |
|
2002 Jul 9-11 |
50 |
20 |
28 |
2 |
C. Dairy products
|
|
|
Don't |
No |
|
|
% |
% |
% |
% |
|
|
2006 Dec 8-10 |
71 |
10 |
18 |
* |
|
|
|
|
|
|
|
2004 Jul 8-11 |
67 |
14 |
19 |
* |
|
2002 Jul 9-11 |
70 |
13 |
16 |
1 |
D. Fish and other seafood
|
|
|
Don't |
No |
|
|
% |
% |
% |
% |
|
|
2006 Dec 8-10 |
70 |
11 |
19 |
* |
|
|
|
|
|
|
|
2004 Jul 8-11 |
71 |
11 |
18 |
* |
|
2002 Jul 9-11 |
76 |
10 |
14 |
* |
E. Salt
|
|
|
Don't |
No |
|
|
% |
% |
% |
|
|
|
2006 Dec 8-10 |
24 |
49 |
27 |
* |
|
|
|
|
|
|
|
2004 Jul 8-11 |
23 |
47 |
30 |
* |
|
2002 Jul 9-11 |
27 |
45 |
28 |
* |
F. Sugar
|
|
|
Don't |
No |
|
|
% |
% |
% |
% |
|
|
2006 Dec 8-10 |
22 |
51 |
27 |
* |
|
|
|
|
|
|
|
2004 Jul 8-11 |
21 |
51 |
28 |
* |
|
2002 Jul 9-11 |
29 |
43 |
27 |
1 |
G. Vegetables
|
|
|
Don't |
No |
|
|
% |
% |
% |
% |
|
|
2006 Dec 8-10 |
91 |
2 |
7 |
* |
|
|
|
|
|
|
|
2004 Jul 8-11 |
90 |
2 |
8 |
* |
|
2002 Jul 9-11 |
91 |
2 |
7 |
* |
H. Trans fats
|
|
|
Don't |
No |
|
|
|
|
|
|
|
|
2006 Dec 8-10 |
5% |
64 |
30 |
1 |