GALLUP NEWS SERVICE
PRINCETON, NJ -- Since August, Sen. Hillary Clinton has consistently led the 2008 Democratic presidential field by a better than 20-point margin over Sen. Barack Obama. With a lead of that size -- and unless the race were highly polarized, which it is not -- it's logical that she would also dominate the race among most major Democratic subgroups. And she does.
In the four Gallup presidential election surveys conducted in August and September, Clinton has led Obama by an average of 22 points -- 47% to 25%, respectively. Former Sen. John Edwards holds third place with about half of Obama's level of support, while no other candidate is favored by more than 3% of Democrats and independents who lean Democratic.
|
2007 |
2007 |
2007 |
2007 |
Average |
|
|
% |
% |
% |
% |
% |
|
|
Clinton |
48 |
48 |
45 |
47 |
47 |
|
Obama |
26 |
25 |
24 |
25 |
25 |
|
Edwards |
12 |
13 |
16 |
11 |
13 |
|
Richardson |
4 |
2 |
2 |
5 |
3 |
|
Biden |
3 |
1 |
3 |
3 |
3 |
|
Kucinich |
1 |
2 |
2 |
2 |
2 |
|
Dodd |
* |
1 |
1 |
1 |
1 |
|
Gravel |
-- |
* |
1 |
1 |
1 |
|
Other |
2 |
1 |
2 |
* |
1 |
|
None/ |
5 |
6 |
5 |
4 |
5 |
Clinton Leads in Every Subgroup
According to the aggregated data from the four most recent surveys, Clinton holds a commanding lead among nearly every major subgroup of potential Democratic primary voters. (This includes all adults who consider themselves Democrats as well as independents who lean to the Democratic party.)
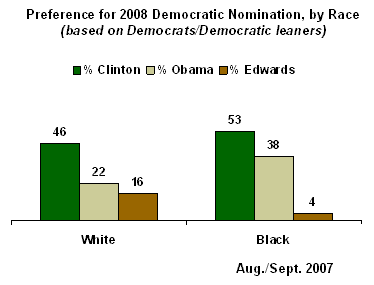
There are certainly differences in the size of Clinton's lead over Obama among various groups of the Democratic population. However, neither the unique factors that Clinton is the first woman to lead either party's presidential nomination contest -- nor that Obama is one of the strongest black Americans ever to run for the presidency -- skews Democrats' preferences enough to make Obama the leader among either blacks or men.
Clinton is most widely favored for the nomination by women, whites, seniors, core Democrats, the non-college educated, those living in low- and middle-income households, self-described conservatives, and residents of the East and West. However, she also leads Obama by smaller but still double-digit margins among most of the natural counterparts to these groups, including men, blacks, young adults, independents, college graduates, self-described moderates and liberals, and residents of the South and Midwest. The table at the end of this report provides the figures for these findings.
All of these patterns are nearly identical to what Gallup found this spring in a similar aggregate data review. Thus, while Clinton has expanded her overall lead since that point, it appears that nothing in the course of the campaign has created fundamental changes in the appeal of Clinton or Obama to various Democratic groups. [See "Clinton Leads Obama Among Whites, Blacks, and Most Other Democratic Subgroups" in Related Items.]
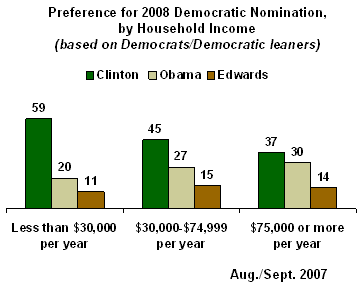
As was the case earlier this year, upper-income Democrats represent one of Clinton's few weak links. Among those living in households with an annual income of $75,000 or more, she leads Obama by only seven points at 37% vs. 30%. This may help explain Obama's competitiveness with Clinton in fundraising -- even though he has not been competitive with her in national Democratic nomination preference polls.
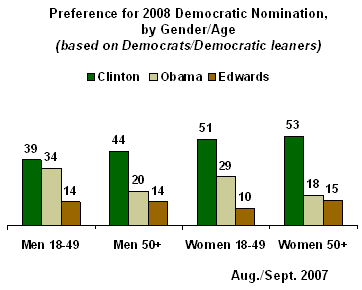
Clinton is also in a relatively stiff battle for votes among younger Democratic men. Whereas she leads Obama by 35 points among women aged 50 and older (53% vs. 18%), she leads by only 5 points among men under the age of 50 (39% vs. 34%).
Nearly 4 in 10 blacks favor Obama for the nomination, compared with fewer than one-quarter of whites (38% vs. 22%). However, blacks' support for Obama does not come at the expense of their support for Clinton. In fact, blacks are more likely than whites to support Clinton. Rather, blacks steer their support to the top two candidates, giving less support to the lower-ranked candidates -- particularly Edwards.
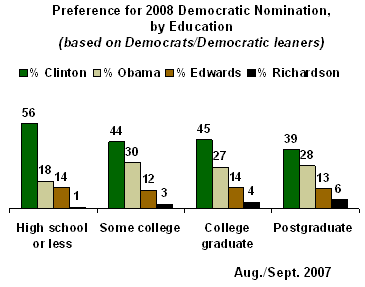
There is some variation in Democratic preferences according to education level. Those with college educations are more likely than those with no college experience to support Obama. On a much smaller scale, the highly educated are also more prone to support former New Mexico Gov. Bill Richardson.
Bottom Line
By rebuilding her strong lead in the Democratic race after it withered some this spring, Clinton is establishing an air of inevitability around her candidacy. That could make it difficult for Obama or Edwards to pull off an upset in the upcoming primaries. That neither Obama nor Edwards leads with even one significant voter subgroup only accentuates the point.
Survey Methods
Results are based on four nationally representative USA Today/Gallup and Gallup Poll surveys conducted between Aug. 3, 2007 and Sept. 16, 2007. The combined database includes 4,069 national adults, aged 18 and older, including 1,989 Democrats and independents who lean Democratic. For results based on the total sample of Democrats and Democratic leaners, one can say with 95% confidence that the maximum margin of sampling error is ±2 percentage points. In addition to sampling error, question wording and practical difficulties in conducting surveys can introduce error or bias into the findings of public opinion polls.
(Asked of Democrats and independents who lean to the Democratic Party) Next, I'm going to read a list of people who may be running in the Democratic primary for president in the next election. After I read all the names, please tell me which of those candidates you would be most likely to support for the Democratic nomination for president in 2008, or if you would support someone else.
[ROTATED: Delaware Senator, Joe Biden; New York Senator, Hillary Clinton; Connecticut Senator, Christopher Dodd; Former North Carolina Senator, John Edwards; Former Vice President, Al Gore; Former Alaska Senator, Mike Gravel; Ohio Congressman, Dennis Kucinich; Illinois Senator, Barack Obama; New Mexico Governor, Bill Richardson]
Preference for 2008 Democratic Nomination by Major Subgroups (Gore Voters Replaced by their Second Choice) Based on Democrats/Lean Democratic August/September 2007 |
|||
|
Clinton |
Obama |
Edwards |
|
|
% |
% |
% |
|
|
Men |
41 |
27 |
14 |
|
Women |
52 |
23 |
13 |
|
|
|
|
|
|
White |
46 |
22 |
16 |
|
Black |
53 |
38 |
4 |
|
|
|
|
|
|
18- to 29-year-olds |
46 |
33 |
11 |
|
30- to 49-year olds |
46 |
30 |
12 |
|
50- to 64-year olds |
47 |
23 |
14 |
|
65 years and older |
51 |
14 |
16 |
|
|
|
|
|
|
East |
53 |
22 |
9 |
|
Midwest |
42 |
28 |
17 |
|
South |
52 |
20 |
16 |
|
West |
41 |
31 |
11 |
|
|
|
|
|
|
High school or less |
56 |
18 |
14 |
|
Some college |
44 |
30 |
12 |
|
College graduate |
45 |
27 |
14 |
|
Postgraduate education |
39 |
28 |
13 |
|
|
|
|
|
|
Less than $30,000 |
59 |
20 |
11 |
|
$30,000 to $75,000 |
45 |
27 |
15 |
|
$75,000 or more |
37 |
30 |
14 |
|
|
|
|
|
|
Men 18-49 |
39 |
34 |
14 |
|
Men 50+ |
44 |
20 |
14 |
|
Women 18-49 |
51 |
29 |
10 |
|
Women 50+ |
53 |
18 |
15 |
|
|
|
|
|
|
Democrats |
50 |
25 |
12 |
|
Democratic-leaning |
42 |
25 |
15 |
|
|
|
|
|
|
Conservative |
53 |
17 |
15 |
|
Moderate |
46 |
25 |
14 |
|
Liberal |
46 |
29 |
11 |