GALLUP NEWS SERVICE
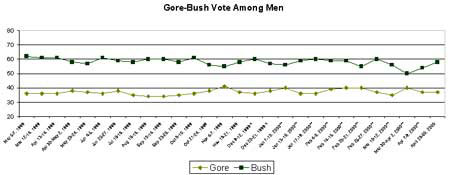
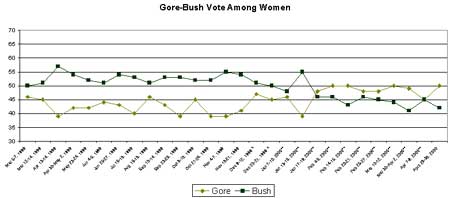
PRINCETON, NJ -- The 2000 presidential election is shaping up to be strongly divided along gender lines, and to a greater degree than has been seen for any other such contest in at least a half century. Gallup's latest national survey of likely voters, conducted April 28-30, shows men favoring Republican candidate George W. Bush over the Democrat, Al Gore, by 58% to 37% -- a 21-point margin. By contrast, women in the same survey favor Gore over Bush by 50% to 42% -- an 8-point margin. That swing in support represents a 29-point "gender gap" separating men and women in their vote preferences, and is generally consistent with the gender voting patterns Gallup has seen since January of this year.
For years the gender gap has been a familiar theme in election analysis, particularly since 1984, when large gender voting differences emerged in the election between Republican incumbent President Ronald Reagan and Democratic challenger Walter Mondale. That year, Gallup's final pre-election survey documented an 18-point gender gap in the vote. However, in contrast with Election 2000, a majority of both men and women sided with the same candidate (Reagan) in the 1984 election. The gender gap emerged because men favored Reagan over Mondale by a 28-point margin, 64% to 36%, compared to women, who favored Reagan by just 10 points, 55% to 45%.
Gallup polls going back to President Eisenhower's first election show that relatively large gender gaps -- on the order of 10 or more points -- were evident in 1952, 1956, 1976, 1980, 1984 and 1996. Smaller gender gaps were seen in 1960, 1964, 1968, 1972, 1988 and 1992.
Nothing, however, comes close to the gender gap evident in the present election, in terms of both its size and the fact that men and women are throwing their support to different candidates. The 18-point gender gap in 1984 comes closest to what is seen today, but as noted, a majority of men and women favored the same candidate in that contest, making the significance of the gap far less important.
Have Women Always Been More Democratic in Their
Voting?
Looking at Gallup's long-term pre-election
trends, it seems clear that women have tended to vote more
Democratic than men have in recent years, starting with the 1980
presidential election. Prior to 1964, women tended to vote more
Republican than did men. Between 1964 and 1976, men and women were
roughly similar in their vote, with 1976 standing out as an
exception. In that year, Gallup polls showed women voting more
Republican, with a majority of women favoring Republican
presidential candidate Gerald Ford and a majority of men favoring
Democrat Jimmy Carter.
Have Men and Women Often Sided With Different
Candidates?
Since 1980, Republicans have won three
presidential elections (1980, 1984 and 1988) and Democrats have won
two elections (1992 and 1996). In each case the plurality or
majority of men and women sided with the same candidate, although
by varying margins. In 1980, both men and women favored Reagan over
Carter, but men by a 15-point margin, compared to only a 5-point
margin among women -- representing a 10-point gender gap. As noted,
1984 saw an 18-point gender gap, with both men and women voting to
re-elect Reagan, but men by a much larger margin than women. In
1988, both men and women favored Republican George Bush over
Democrat Michael Dukakis; however, Bush led among men by 12 points,
compared to just 4 points among women -- an 8-point gender gap. In
1992, both men and women favored Democrat Bill Clinton over the
incumbent Republican president, George Bush. However, women favored
Clinton by a slightly wider margin than men did -- resulting in a
4-point gender gap. Finally, in 1996, Gallup showed Clinton winning
re-election over Republican challenger Bob Dole by just a 1-point
margin among men, but by 15 points among women -- yielding a
14-point gender gap.
In this context, the current voting patterns by gender are remarkable, with Texas Governor Bush leading Vice President Gore by 21 points among men, and Gore leading Bush by 8 points among women.
The last time men and women sided with different candidates was 1976, when a majority of men backed Jimmy Carter and a majority of women backed Gerald Ford. Prior to that, there are only two other examples of divergent vote choices. In 1968, men tended to side with Republican Richard Nixon over Democrat Hubert Humphrey by a 2-point margin, 43% to 41%, and women sided with Humphrey over Nixon by a 2-point margin, 45% to 43%. And in 1960, men sided with Democrat John F. Kennedy by 4 points, 52% to 48%, and women backed Republican Richard Nixon by 2 points, 51% to 49%. In each of these three cases (1960, 1968 and 1976), the vote choice of men prevailed, with Kennedy, Nixon and Carter winning their respective elections. Thus, there is no example in Gallup election trends dating back to 1952 of a president being elected solely on the basis of the women's vote, while there are three examples of the election being decided by men.
Is Bush Underperforming Among Women, or Overperforming
Among Men?
One election that puts George W. Bush's
current standing with the genders in context is 1992.
Coincidentally, in that election President George Bush, facing Bill
Clinton, suffered an identical deficit among women as does his son
today (8 points). However, a sharp contrast is evident in the vote
pattern of the two Bushes among men. In 1992, men favored Clinton
by a 4-point margin, 41% to 37%. Today, men favor George W. Bush by
a 21-point margin. Of course, the senior Bush lost the 1992
election to Clinton by 6 percentage points. By contrast, Bush the
junior currently leads Al Gore by 5 percentage points. In these
terms it therefore appears George W. Bush is overperforming among
men, rather than underperforming among women.
Is the Gender Gap Stable in 2000?
Men's solid
preference for George W. Bush over Al Gore has been a constant
factor in Gallup's 2000 Election polls, dating back more than a
year. Men have favored Bush over Gore by a 20-point or greater
margin in 20 out of 28 Gallup election polls taken since March
1999. By contrast, the candidate preference of women has switched
from favoring Bush to now favoring Gore. Women favored Bush
throughout 1999 and into early January 2000. However, once the
primary election season started in January, Gore picked up support
among women, and has generally managed to hold their support ever
since.


Survey Methods
The latest results are based on
telephone interviews with a randomly selected national sample of
499 likely voters, 18 years and older, conducted April 28-30, 2000.
For results based on this sample, one can say with 95 percent
confidence that the maximum error attributable to sampling and
other random effects is plus or minus 5 percentage points. In
addition to sampling error, question wording and practical
difficulties in conducting surveys can introduce error or bias into
the findings of public opinion polls.
|
VOTE FOR PRESIDENT BY GENDER, 1952-2000 |
||||
|
All Trends Through 1996 Based on Final Pre-Election Gallup Surveys |
||||
|
National |
Men |
Women |
Gender Gap |
|
|
% |
% |
% |
% |
|
|
April 28-30, 2000 |
||||
|
Democrat: Gore |
44 |
37 |
50 |
|
|
Republican: Bush |
49 |
58 |
42 |
|
|
GAP |
-5 |
-21 |
8 |
29 |
|
1996 |
||||
|
Democrat: Clinton |
49 |
45 |
53 |
|
|
Republican: Dole |
41 |
44 |
38 |
|
|
GAP |
8 |
1 |
15 |
14 |
|
1992 |
||||
|
Democrat: Clinton |
43 |
41 |
46 |
|
|
Republican: Bush |
38 |
37 |
38 |
|
|
GAP |
5 |
4 |
8 |
4 |
|
1988 |
||||
|
Democrat: Dukakis |
46 |
44 |
48 |
|
|
Republican: Bush |
54 |
56 |
52 |
|
|
GAP |
-8 |
-12 |
-4 |
8 |
|
1984 |
||||
|
Democrat: Mondale |
41 |
36 |
45 |
|
|
Republican: Reagan |
59 |
64 |
55 |
|
|
GAP |
-18 |
-28 |
-10 |
18 |
|
1980 |
||||
|
Democrat: Carter |
41 |
38 |
44 |
|
|
Republican: Reagan |
51 |
53 |
49 |
|
|
GAP |
-10 |
-15 |
-5 |
10 |
|
1976 |
||||
|
Democrat: Carter |
50 |
53 |
48 |
|
|
Republican: Ford |
48 |
45 |
51 |
|
|
GAP |
2 |
8 |
-3 |
11 |
|
1972 |
||||
|
Democrat: McGovern |
38 |
37 |
38 |
|
|
Republican: Nixon |
61 |
63 |
62 |
|
|
GAP |
-23 |
-26 |
-24 |
2 |
|
1968 |
||||
|
Democrat: Humphrey |
42.7 |
41 |
45 |
|
|
Republican: Nixon |
43.4 |
43 |
43 |
|
|
GAP |
-0.7 |
-2 |
2 |
4 |
|
1964 |
||||
|
Democrat: Johnson |
61 |
60 |
62 |
|
|
Republican: Goldwater |
39 |
40 |
38 |
|
|
GAP |
22 |
20 |
24 |
4 |
|
1960 |
||||
|
Democrat: Kennedy |
49.9 |
52 |
49 |
|
|
Republican: Nixon |
49.8 |
48 |
51 |
|
|
GAP |
0.1 |
4 |
-2 |
6 |
|
1956 |
||||
|
Democrat: Stevenson |
42 |
45 |
39 |
|
|
Republican: Eisenhower |
58 |
55 |
61 |
|
|
GAP |
-16 |
-10 |
-22 |
12 |
|
1952 |
||||
|
Democrat: Stevenson |
44 |
47 |
42 |
|
|
Republican: Eisenhower |
55 |
53 |
58 |
|
|
GAP |
-11 |
-6 |
-16 |
10 |