GALLUP NEWS SERVICE
PRINCETON, NJ -- With Labor Day set aside to honor the nation's workers, a recent Gallup poll shows that the vast majority of employed Americans say they are at least somewhat satisfied with their jobs, with more than four in 10 "completely" satisfied. In addition, a third of American workers say they love their job, and more than eight in 10 say they have a strong sense of loyalty to their employer. The poll also shows that there is a high correlation between job satisfaction and both education and family income, with higher-educated and higher-income Americans more positive about their jobs.
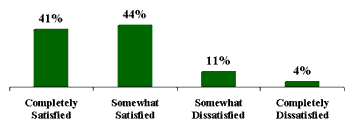
The poll was conducted August 16-19 and finds 41% of Americans who are employed either full- or part-time saying they are "completely" satisfied with their jobs, while another 44% are "somewhat" satisfied. Just 15% say they are dissatisfied -- 11% "somewhat" and 4% "completely."
| Most American Workers Satisfied With
Job How satisfied or dissatisfied are you with your job? |
 |
| Aug. 16-19, 2001 |
The percentage of American workers who are completely satisfied is substantially higher this year than in 1989, when Gallup first asked the question in this format and found 28% expressing that view. In a 1997 poll, that percentage had climbed to 35%, and two years later it was at 39%. The percentage who are dissatisfied, however, has changed only slightly over the years. It was 11% in 1989, 13% in 1997, and 14% in 1999.
In previous years, dating back to the 1950s, Gallup asked about job satisfaction using various question wordings. In general, the results over the years have shown the vast majorities of workers expressing satisfaction with their jobs. For example, a 1950 Gallup poll found 56% of workers saying they got "a lot of satisfaction and pleasure" out of their jobs, while another 32% said they got a "fair amount of satisfaction and pleasure" from their jobs.
In the 1960s, Gallup began asking whether people were satisfied or dissatisfied with the work they were doing. The results all showed greater than eight in 10 indicating they were satisfied. In the 1970s, the results were similar, but one poll in 1984 showed just 70% saying they were satisfied. However, a 1988 poll with a different question showed that 87% of workers were either very or somewhat satisfied with their jobs, similar to results that are found in the current poll (the wording in the current poll uses "completely" instead of "very").
A separate question in the current poll finds that 32% of workers say they love their job, while another 59% say they like it. Just 6% say they dislike it, while only 2% say they hate their job. Thus, regardless of the wording, very large majorities of American workers over the years have expressed satisfaction with their jobs.
Over Half of American Workers See Job as "Sense of Identity"
Some people see their job as just what they do for a living, but others get a sense of identity from their job. The poll finds that this year, 54% of Americans say they get a sense of identity from their job, slightly higher than the percentage who said that in 1999 (51%), but slightly lower than the number who said that in three previous Gallup polls that go back to 1989. In those polls, from 57% to 58% said they got a sense of identity from their jobs.
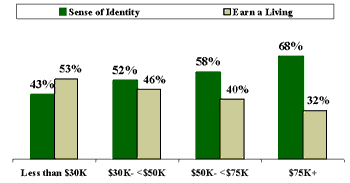
How workers view their job is highly correlated with both education and income. The higher the education and income levels, the more likely workers are to see a sense of identity in their jobs. The pattern is illustrated below, where household income is compared with attitude about one's job.
| Job: Sense of Identity or Just to Earn a
Living? Compared by Household Income |
 |
| Aug. 16-19, 2001 |
The distinction between these two ways of viewing one's job correlates highly with job satisfaction. Among those who see their job primarily as a way to make a living, just 27% are completely satisfied with their jobs, compared with 50% among those who get a sense of identity from their jobs.
More Than Eight in 10 American Workers Express Strong Loyalty to Employer
The vast majority of workers, 83%, say they have a strong sense of loyalty to their company or the organization that employs them. However, only 64% say their company has a strong sense of loyalty to them. These results mean that 63% of all workers express loyalty to their company and feel it is reciprocated. That leaves 18% of workers who express loyalty, but believe it is not reciprocated by their employer, and another 14% who say that loyalty is lacking on both sides.
Do you have a strong sense of loyalty to the company or organization you work for, or not?
|
Yes, strong |
|
No |
|
|
% |
% |
% |
|
|
2001 Aug 16-19 |
83 |
16 |
1 |
|
1998 Sep |
85 |
14 |
1 |
|
1993 May 10-13 |
86 |
12 |
2 |
Does the company you work for have a strong sense of loyalty to you, or not?
|
Yes, strong |
|
No |
|
|
% |
% |
% |
|
|
2001 Aug 16-19 |
64 |
32 |
4 |
|
1998 Sep |
66 |
32 |
2 |
|
1993 Dec 4-6 |
73 |
24 |
3 |
|
1993 May 10-13 |
67 |
30 |
3 |
Net Result
|
2001 Aug 16-19
|
||
|
Worker has strong loyalty; company has strong loyalty |
63% |
|
|
Worker has strong loyalty; company does not |
18 |
|
|
Worker has strong loyalty, but unsure about company |
2 |
|
|
Worker does not have strong loyalty; company does |
2 |
|
|
Neither worker nor company have strong loyalty to each other |
14 |
|
|
No opinion |
1 |
|
|
TOTAL |
100% |
|
As the tables show, there has been little change over the years in the number of Americans who say they have a strong sense of loyalty to their employers, but there has been some moderate fluctuation in the percentage of workers who feel their companies have loyalty to them. In December 1993, 73% felt their employer had a strong sense of loyalty to them, but in the May 1993 poll, as well as in the 1998 and current polls, the percentage is several points lower.
One-Third of Workers Would Be Happier in Another Job
Despite the generally high level of worker satisfaction, a third of all workers say they would be happier in another job. These results are not much different from those found in a 1998 Gallup poll, but a 1965 Gallup poll found just 21% who said they would be happier in another job. A decade before that, however, the results were similar to those found in the current poll.
Do you think you would be happier in a different job?
|
Yes |
No |
No opinion |
|
|
% |
% |
% |
|
|
2001 Aug 16-19 |
33 |
61 |
6 |
|
1998 Sep |
34 |
63 |
3 |
|
1965 Jan 7-12 |
21 |
66 |
13 |
|
1955 Jun 24-29 |
32 |
63 |
5 |
Job Satisfaction Highly Related to Income
The poll finds that satisfaction with one's job, and whether one would be happier in another job, are both highly correlated with education and income. The higher the income and the greater the education, the more likely people are to find a sense of identity in their job and the more satisfied they feel about it.
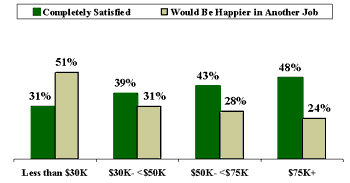
As shown in the chart below, workers in households with income levels below $30,000 a year are most likely to say they would be happier in another job (51%) and least likely to say they are "completely" satisfied with their job (31%). As income levels increase, the percentage who say they are "completely" satisfied also increases, and the percentage who say they would be happier in another job declines.
| Satisfaction With Job vs. Happier in Another
Job Compared by Household Income |
 |
| Aug. 16-19, 2001 |
Survey Methods
The results reported here are based on telephone interviews with a randomly selected national sample of 1,013 adults, 18 years and older, conducted August 16-19, 2001. Included in this sample are 599 adults who say they are employed either part-time or full-time. For results based on this sample of 599 employed adults, one can say with 95 percent confidence that the maximum error attributable to sampling and other random effects is plus or minus 4 percentage points. In addition to sampling error, question wording and practical difficulties in conducting surveys can introduce error or bias into the findings of public opinion polls.
How satisfied or dissatisfied are you with your job? Would you say you are -- completely satisfied, somewhat satisfied, somewhat dissatisfied, or completely dissatisfied with your job?
|
Completely satisfied |
Somewhat satisfied |
Somewhat dissatisfied |
Completely dissatisfied |
No |
|
|
% |
% |
% |
% |
% |
|
|
2001 Aug 16-19 |
41 |
44 |
11 |
4 |
0 |
|
1999 Aug 24-26 |
39 |
47 |
12 |
2 |
* |
|
1997 Aug 22-25 |
35 |
51 |
10 |
3 |
1 |
|
1989 Jul 18-21 |
28 |
61 |
8 |
3 |
* |
|
* Less than 0.5% |
|||||
Here are two different ways of looking at your job. Some people get a sense of identity from their job. For other people, their job is just what they do for a living. Which of these best describes the way you usually feel about your job?
|
Sense of identity |
Just what you do |
No opinion |
|
|
% |
% |
% |
|
|
2001 Aug 16-19 |
54 |
44 |
2 |
|
1999 Aug 24-26 |
51 |
47 |
2 |
|
1998 Oct |
57 |
40 |
3 |
|
1993 May 10-11 |
58 |
41 |
1 |
|
1989 Jul 18-21 |
57 |
40 |
3 |
All in all, which of the following best describes how you feel about your job -- [ROTATED: you love it, you like it, you dislike it, (or) you hate it]?
|
|
|
|
|
NEITHER (vol.) |
No |
|
|
2001 Aug 16-19 |
32% |
59 |
6 |
2 |
1 |
0 |
(vol.) Volunteered response

