GALLUP NEWS SERVICE
PRINCETON, NJ -- For the past half century, both men and women have indicated a greater preference for male than female bosses. A recent Gallup poll shows that pattern still prevails today, although the percentage of people expressing no preference is the highest it has ever been. Part of this more accepting attitude may be because there are more women in leadership positions than in the past. The poll shows that people who currently work for women, or have done so in the past, are far more likely to be favorable toward them as bosses than are people who have worked only for men.
In 1953, when Gallup first asked the question of preference for a male or female boss, overwhelmingly both men and women indicated they would prefer a male to a female boss. Among all Americans, 66% chose a male boss, just 5% chose a female, and 25% indicated no preference.
| Overall: Prefer Male or Female Boss |
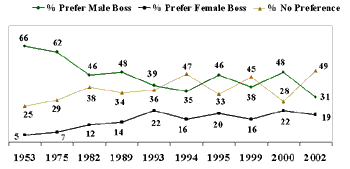 |
By the 1980s, the margin in favor of male over female bosses had slipped to 46% to 12%, at the same time that the percentage of respondents indicating no preference increased to 38%. Overall, this meant that exactly half of all Americans saw female bosses as either better than, or just as acceptable as, male bosses.
Over the next two decades, there was only a slight increase in the percentage of people who indicated a preference for female bosses -- going from 12% in 1982 to a high of 22% in 1993 and 2000, only slightly above the current level of 19%. The percentage of people expressing no preference during this period has varied from a low of 28% in 2000 to the current high of 49%. Combined with the 19% who currently prefer to work for females, these figures show that more than two-thirds of Americans, 68%, now find female bosses at least as acceptable as male bosses. Still, the gender bias remains, as 80% of Americans find male bosses at least as acceptable as female bosses.
Gender Gap Has Narrowed
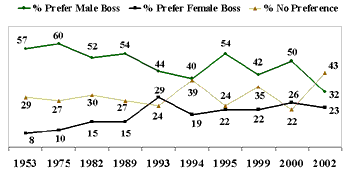
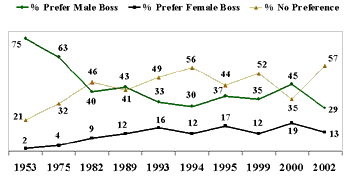
The initial reading of attitudes in 1953 found more men than women who were biased against female bosses. In 1975, the gender gap narrowed. Women preferred male to female bosses by 60% to 10%, while men expressed the same bias by a slightly larger margin of 63% to 4%. In 1982, however, the gender gap reversed. Men expressed more favorable attitudes about female bosses than did women. Over the next two decades, the differences between those who preferred male bosses and those who preferred female bosses were sometimes slightly larger among men than women, but men were much more likely to express no preference – so that overall men tended to be more accepting of females as bosses than were women. In the latest reading, the differences between men and women have once again narrowed.
| Women: Prefer Male or Female Boss |
 |
| Men: Prefer Male or Female Boss |
 |
Another way to look at the data is to compare the percentages of men and women who can be classified as "accepting" of female bosses -- they say either that they prefer female to male bosses, or that they find female bosses as acceptable as male bosses.
| Men Have Been More Accepting of Female Bosses Than Have Women |
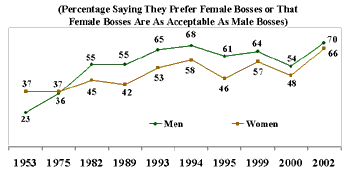 |
In 1953, women were more "accepting" of female bosses than were men, by 37% to 23%. In 1975, the percentages were almost equal for men (36%) and women (37%). But from 1982 on, men have consistently been more accepting than women of female bosses, with the largest margin, 15 percentage points, measured in 1995. The current reading, showing men more accepting than women of female bosses by just 70% to 66%, is the smallest margin in the past 20 years.
Younger Women More Accepting of Female Bosses Than Are Older Women; Little Difference by Age Among Men
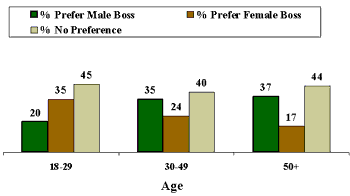
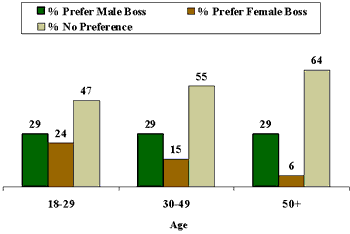
For women, the younger they are, the more likely they are to find female bosses acceptable. For men, however, the pattern is more complicated. Younger men are more likely to say they prefer female bosses, while older men are more likely to say that either gender of boss is acceptable.
Women under 30 prefer female to male bosses -- by 35% to 20%, with another 45% expressing no preference. This is the only age and gender group in which more respondents choose female over male bosses. Older women, by contrast, are less likely to accept a female boss. Women between the ages of 30 and 49 prefer a male boss by 35% to 24%, and older women (those aged 50 and older) prefer a male boss by an even larger margin of 37% to 17%.
| Women: Preference for Gender of Boss Compared by Age |
 |
Among all age groups of men, about three in 10 (29%) say they prefer a male to a female boss. Among the youngest group of men, another 24% say they prefer a female to a male boss, but among middle-aged men, that percentage declines to 15% and among the oldest group it declines even further, to 6%. However, the decline does not mean that older men are more likely to prefer a male boss, but rather that they are more likely to say that either gender of boss is acceptable to them.
| Men: Preference for Gender of Boss Compared by Age |
 |
Experience a Major Factor in Gender Preference
The poll shows that probably the most important factor in predicting the views of those who are currently working is the experience they have had with male and female bosses. Workers who currently have a male boss and have worked only for a male boss are much more likely than other workers to prefer the gender of the boss they work for. Among such workers, 41% say they prefer a male boss, compared with 11% who favor a female boss, and 44% who express no preference.
| Preference for Gender of Boss Compared by Gender of Bosses Worked For |
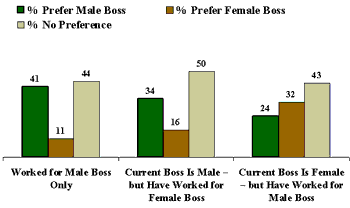 |
Among people who currently work for a male boss, but have worked for a female at some previous time, the bias in favor of a male boss is much smaller -- 34% prefer a male boss, 16% prefer a female boss, and 50% express no preference. Among people whose current boss is a female, but who have previously worked for a male, the pattern is reversed -- by 32% to 24% they prefer a female to a male boss, with another 43% expressing no preference.
These figures differ only a little among men and women, suggesting that the gender of one's current boss is probably the most influential factor in determining which gender workers prefer.
Survey Methods
The latest results are based on telephone interviews with 1,009 national adults, aged 18+, conducted April 22-24, 2002. For results based on the total sample of national adults, one can say with 95% confidence that the margin of sampling error is ±3 percentage points.
For results based on the sample of -- 586 -- adults employed full- or part-time, the maximum margin of sampling error is ±4 percentage points. There are 487 males and 522 females in the sample. For each gender group, the margin of error is ±4 percentage points. The margin of error for the 274 males and 249 females who are working and have a boss is ±7 percentage points.
In addition to sampling error, question wording and practical difficulties in conducting surveys can introduce error or bias into the findings of public opinion polls.
If you were taking a new job and had your choice of a boss would you prefer to work for a man or a woman?
|
Prefer |
Prefer |
NO DIFFERENCE (vol.) |
No |
|
|
% |
% |
% |
% |
|
|
National Adults |
||||
|
2002 Apr 22-24 |
31 |
19 |
49 |
1 |
|
2000 Dec 2-4 |
48 |
22 |
28 |
2 |
|
1999 Aug 24-26 |
38 |
16 |
45 |
1 |
|
1995 Sep 14-17 |
46 |
20 |
33 |
1 |
|
1994 Jun 25-28 |
35 |
16 |
47 |
2 |
|
1993 Aug 23-25 |
39 |
22 |
36 |
3 |
|
1989 Dec 18-21 |
48 |
14 |
34 |
4 |
|
1982 Jun 25-28 |
46 |
12 |
38 |
4 |
|
1975 |
62 |
7 |
29 |
2 |
|
1953 |
66 |
5 |
25 |
4 |
|
Men |
||||
|
2002 Apr 22-24 |
29 |
13 |
57 |
1 |
|
2000 Dec 2-4 |
45 |
19 |
35 |
1 |
|
1999 Aug 24-26 |
35 |
12 |
52 |
1 |
|
1995 Sep 14-17 |
37 |
17 |
44 |
2 |
|
1993 Aug 23-25 |
33 |
16 |
49 |
2 |
|
1982 Jun 25-28 |
40 |
9 |
46 |
5 |
|
1975 |
63 |
4 |
32 |
1 |
|
1953 |
75 |
2 |
21 |
2 |
|
Women |
||||
|
2002 Apr 22-24 |
32 |
23 |
43 |
2 |
|
2000 Dec 2-4 |
50 |
26 |
22 |
2 |
|
1999 Aug 24-26 |
42 |
22 |
35 |
1 |
|
1995 Sep 14-17 |
54 |
22 |
24 |
* |
|
1993 Aug 23-25 |
44 |
29 |
24 |
3 |
|
1982 Jun 25-28 |
52 |
15 |
30 |
3 |
|
1975 |
60 |
10 |
27 |
3 |
|
1953 |
57 |
8 |
29 |
6 |
|
(vol.) Volunteered response |
||||
Is your current boss a man or a woman?
BASED ON -- 586 -- ADULTS EMPLOYED FULL- OR PART-TIME
|
|
|
DON'T HAVE |
No |
|
|
% |
% |
% |
% |
|
|
National Adults |
||||
|
2002 Apr 22-24 |
62 |
29 |
8 |
1 |
|
Men |
||||
|
2002 Apr 22-24 |
72 |
17 |
10 |
1 |
|
Women |
||||
|
2002 Apr 22-24 |
51 |
42 |
6 |
1 |
|
(vol.) Volunteered response |
||||
Have you ever worked for a boss who was a woman, or not?
BASED ON -- 421 -- ADULTS WHO CURRENTLY DO NOT HAVE A FEMALE BOSS
|
Yes, have |
No, have not |
No opinion |
|
|
% |
% |
% |
|
|
National Adults |
|||
|
2002 Apr 22-24 |
74 |
26 |
0 |
|
Men |
|||
|
2002 Apr 22-24 |
69 |
31 |
0 |
|
Women |
|||
|
2002 Apr 22-24 |
83 |
17 |
0 |
Have you ever worked for a boss who was a man, or not?
BASED ON -- 228 -- ADULTS WHO CURRENTLY DO NOT HAVE A MALE BOSS
|
Yes, have |
No, have not |
No opinion |
|
|
% |
% |
% |
|
|
National Adults |
|||
|
2002 Apr 22-24 |
92 |
7 |
1 |
|
Men |
|||
|
2002 Apr 22-24 |
94 |
6 |
0 |
|
Women |
|||
|
2002 Apr 22-24 |
91 |
7 |
2 |
COMBINED RESPONSES (Q.36-38)
BASED ON -- 586 -- ADULTS EMPLOYED FULL- OR PART-TIME
|
Had male |
Had female |
Had both |
|
|
% |
% |
% |
|
|
National Adults |
|||
|
2002 Apr 22-24 |
18 |
3 |
79 |
|
Men |
|||
|
2002 Apr 22-24 |
26 |
1 |
73 |
|
Women |
|||
|
2002 Apr 22-24 |
9 |
4 |
87 |

