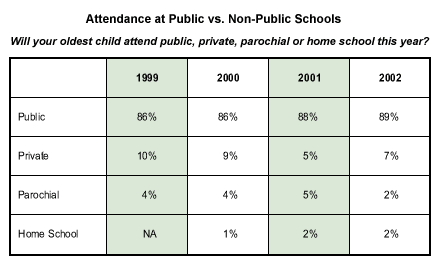
In the last few weeks, more than 50 million American children grabbed their backpacks and headed for the classroom -- most, but not all, returned to public schools. Aggregated Gallup data from 2000 to 2002* indicate that 11% of parents send their oldest child to a non-public -- i.e., private, parochial, or home -- school.

Which parents are most likely to opt out of the public school system? Despite popular images of an elite group of private school children, the demographics of families with kids attending public and non-public schools are remarkably similar. Those sending children to non-public schools are proportionally similar in four U.S. geographic regions -- 15% in the East, 11% each in the West, Midwest and South.
Neither are ideological differences noticeably related to school choice. Of those respondents identifying themselves as liberal, 16% choose a non-public school, while 12% of conservatives report doing so. White and nonwhite parents are statistically identical when it comes to choosing non-public schools for their children, 12% and 13%, respectively. Equal numbers of whites and nonwhites choose the three non-public options -- 7% for private, 4% for parochial, and 2% for home schooling.
Two Groups Stand Apart
Two demographic categories do appear to be significantly related to school choice. First, more city dwellers choose to send their children to non-public schools (17%) than do parents in rural areas (7%). Beverly Millard, a New York City artist, explains her reasons for sending her daughters to private school. "I would have preferred to send my kids to public school -- it's more real world -- but the reputation of the city's public schools worried us. After observing their experience in a single-sex private school for all these years, I am most grateful for the small classes and careful attention of their teachers."
Their own education levels also appear to be relevant to parents' choices -- 22% of those with post-graduate degrees and 19% of college graduates send their children to non-public schools, compared to 8% of those with a high school education or less. An obvious explanation is that those with less education are simply less able to afford non-public schooling -- but interestingly, household income levels above $20,000 per year do not seem to make a great difference in parents' choices of public or non-public education. Sixteen percent of parents with household incomes of $75,000 or higher choose non-public schools, but so do 14% of those making between $50,000 and $75,000, 12% of those with household incomes between $30,000 and $50,000, and 11% between $20,000 and $30,000.
Reasons to Opt Out
The hallmark of non-public schools is choice. While parents choose non-public education for a variety of reasons, recent findings from the Phi Delta Kappa/Gallup Poll of the Public's Attitudes Toward the Public Schools** may provide a clue to why some opt out of the public system.
When Americans are asked what they think is the biggest problem facing the public schools in their community, three responses top the list: lack of funding, lack of discipline and overcrowded classrooms. Do these reasons resonate with Robert Honstein, a New Jersey investment manager with a son in private school and two daughters in parochial schools? "I think class size is a key factor for all children," Honstein said. "Large public schools by definition can't be all things to all students. My kids are complex individuals and each needs a different learning environment."
Key Points
The demographics of parents exercising private, parochial or home-schooling options raise questions for public schools. Gallup data show that parents opting out of public schools don't cluster into segregated categories, rather, it appears that most groups educate their children according to their individual needs -- whether in public, private, parochial or home-school settings. Alternatives to public education appear to have the greatest appeal in urban environments. But spanning all communities, geographic regions and most income levels, parents with extensive schooling of their own seem particularly inclined to educate their children outside the public system.
*These results are based on telephone interviews with randomly selected national samples of approximately 1,000 adults, aged 18 and older. For results based on these samples, one can say with 95% confidence that the maximum error attributable to sampling and other random effects is ±3%. In addition to sampling error, question wording and practical difficulties in conducting surveys can introduce error or bias into the findings of public opinion polls.
**These results are based on telephone interviews with a randomly selected national sample of 1,000 adults, aged 18 and older, conducted June 5-26, 2002. For results based on this sample, one can say with 95% confidence that the maximum error attributable to sampling and other random effects is ±3%. In addition to sampling error, question wording and practical difficulties in conducting surveys can introduce error or bias into the findings of public opinion polls.