GALLUP NEWS SERVICE
PRINCETON, NJ -- A variety of institutions and players contribute to public affairs in the United States, including the three branches of the federal government and the elected and appointed officials that populate them; the media; and of course, the American public. A recent Gallup Poll asked Americans to evaluate the amount of trust they have in each of these groups to perform its role in the democratic process.
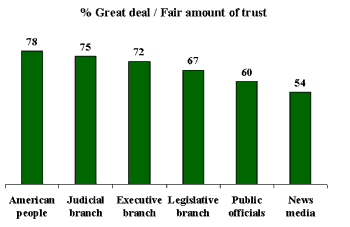
According to the Sept. 5-8 survey, the American people themselves get a slightly higher vote of confidence than do the government branches and institutions tested, while the media receive the lowest vote of confidence. Nearly four in five Americans, 78%, told Gallup that they have a great deal or fair amount of confidence in the American people "when it comes to making judgments under our democratic system about the issues facing our country." Barely half, 54%, express this degree of confidence in the media to "report the news fully, accurately, and fairly."
While the public has the highest scores of the six groups tested on this year's survey, the judicial branch of the federal government, headed by the U.S. Supreme Court, and the executive branch, headed by the president, receive confidence scores of 75% and 72%, respectively, which are almost as high. The legislative branch, consisting of the U.S. Senate and House of Representatives, receives a slightly lower score of 67%. The men and women in political life who either hold or are running for public office receive a confidence score of 60%.
| 2002 Confidence Scores |
 |
| Sep. 5-8, 2002 |
The three groups falling in the bottom half of the list are each given a vote of low confidence by a substantial minority of Americans. Approximately one-third of Americans (32%) say they have either "not very much" or no confidence at all in the legislative branch. This figure is 39% for politicians in general and 46% for the media.
Changes Since Last Year
These questions asking the public for its evaluations of confidence in various groups were asked by The Gallup Organization for a brief period in the 1970s and then discontinued for over 20 years before they were reinstated in 1997. Since then, they have been asked annually. Last year's update occurred Sept. 7-10, immediately before the Sept. 11 attacks that killed an estimated 3,000 Americans. Thus, a comparison of this year's results to last year's can shed light on the impact of that terrorist incident on Americans' confidence in the major sectors involved in public affairs.
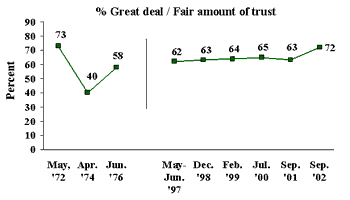
The largest change since September 2001 is seen in attitudes toward the executive branch, which have grown more positive by nine percentage points: 72% today have a great deal or fair amount of confidence in the executive branch today, compared with 63% last year. Americans have also grown more confident in public officials and in the American people. Attitudes toward the judicial and legislative branches, as well as toward the news media, remain about the same.
Long-Term Trends
At 72%, public trust in the executive branch of government today under George W. Bush is back to the level recorded by Gallup in May 1972 -- just one month before burglars linked to the Republican Party were caught inside the Democratic National Committee headquarters at Washington's Watergate complex. Two years later, trust in the executive branch under Richard Nixon had dropped to 40%. But trust quickly rebounded to 58% two years after that, under Gerald Ford. Trust in the executive branch was consistently in the low to mid-60s during Bill Clinton's presidency, reaching a high of 65% in July 2000. Today's somewhat higher trust level is a clear reflection of the elevated approval Americans have had for President Bush since the Sept. 11 attacks.
| Trust in the Executive Branch |
 |
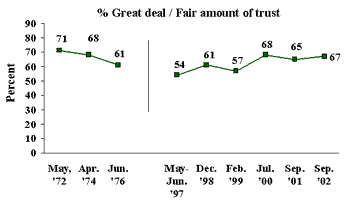
Americans have expressed fairly high trust in the legislative branch of the federal government for the last several years, with no apparent lasting impact from Sept. 11, 2001. The current level of about two-thirds of Americans saying they have a great deal or fair amount of confidence in the legislative branch is just below where this indicator stood prior to Watergate in 1972, and is slightly better than the average score of 57% recorded during the late 1990s.
| Trust in the Legislative Branch |
 |
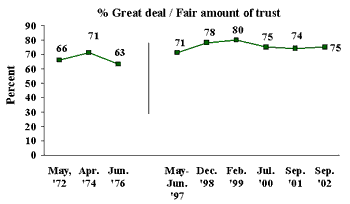
Public trust in the judicial branch of the federal government is somewhat higher today than it was in the early 1970s, but it is lower than three to four years ago when up to 80% of Americans gave the judicial branch high confidence ratings. Trust in the judicial branch, led by the Supreme Court, slipped slightly to 75% in July 2000. This decline occurred before the court's controversial ruling that decided the Florida vote in the 2000 presidential election. Confidence in the court has remained at about 75% since 2000.
| Trust in the Judicial Branch |
 |
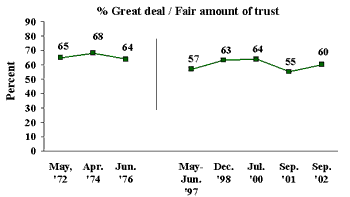
"Politics" may be a dirty word to some, but about six in 10 Americans have consistently told Gallup over the years that they have a great deal or fair amount of confidence in the men and women working as public officials in this country. That was true at the height of the Watergate scandal, as well as earlier and afterward.
| Trust in Public Officials |
 |
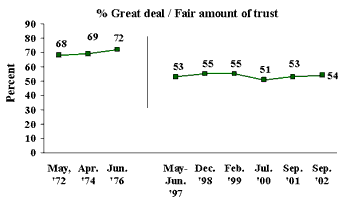
Since 1997, Gallup has found little change in public trust in the mass media, with just over half expressing high confidence in the media to report the news "fully, accurately, and fairly." But these ratings are markedly lower than where they stood in the early 1970s, both pre- and post-Watergate.
| Trust in the News Media |
 |
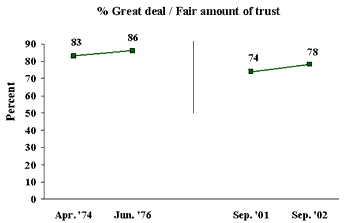
As much confidence as the public has in the American people (i.e., in itself) today, it had even more when Gallup first recorded this in the mid-1970s.
| Trust in the American People |
 |
Ratings Disparities Among the Parties
The largest differences in public trust ratings are based on party identification. Republicans give their highest marks to the executive branch, followed by the judicial branch and then the American public. Democrats express highest confidence in the public, followed by the legislative and judicial branches, and then by public officials and the media, with the executive branch ranking last. Political independents also tend to give their highest ratings to the public, with the judicial branch ranking second and the executive branch third.
|
% Trust a Great Deal/Fair Amount by Party ID
|
|||
|
Republicans |
Independents |
Democrats |
|
|
Executive Branch |
93 |
69 |
53 |
|
Judicial Branch |
83 |
77 |
67 |
|
Legislative Branch |
71 |
63 |
69 |
|
News/Mass Media |
49 |
52 |
59 |
|
Public Officials |
67 |
54 |
60 |
|
American Public |
81 |
79 |
75 |
Why do these differences occur between the parties?
- Partisan ratings of the executive branch are obviously tied to the fact that the executive branch is currently in Republican hands, with George W. Bush as president.
- The higher confidence expressed by Republicans than by Democrats in the judiciary may be a result of the controversial role the Supreme Court played in deciding the 2000 presidential election in George W. Bush's favor. (A separate Gallup trend measuring public approval for the way the Supreme Court is doing its job found a sharp change in Republican and Democratic attitude toward the high court shortly after it ended the Florida recount process, with Democrats becoming much more critical.)
- Democrats' high confidence in the news media is most likely due to the Democrats' more favorable perceptions of the news media's fairness. The Sept. 5-8 Gallup Poll finds that a majority of Democrats perceive the news media to be mostly balanced in their news coverage; only 18% perceive them as being too conservative and only 27% say they are too liberal. By contrast, nearly three-quarters of Republicans (72%) say the media are too liberal, while only 20% say the news media are about right in their coverage.
A Generational Swing?
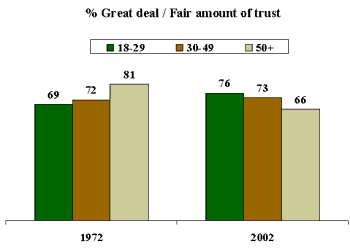
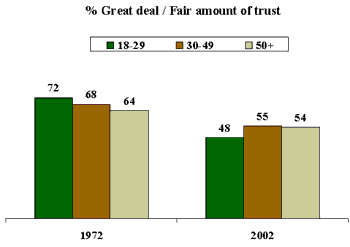
In 1972, before Watergate but after the Vietnam War had already sparked a cultural revolution among young people, adults aged 18-29 tended to be less trusting than their elders in the executive branch of government and in public officials generally, while being the most trusting in the news media. Today this pattern is reversed, as young adults express more confidence than do older age groups in all three branches of government, while expressing markedly lower trust in the news media.
| Confidence in the Executive Branch |
 |
| Confidence in the News Media |
 |
Obviously, over the 30 years spanning this transformation of young people's views, much has transpired that could account for their more pro-government and anti-media outlooks today. The interesting question now is whether these changes will hold. The answer could have important implications for the importance of the Fourth Estate in the future, as an additional check and balance on government.
Survey Methods
These results are based on telephone interviews with a randomly selected national sample of 1,004 adults, 18 years and older, conducted Sept. 5-8, 2002. For results based on this sample, one can say with 95 percent confidence that the maximum error attributable to sampling and other random effects is plus or minus 3 percentage points. In addition to sampling error, question wording and practical difficulties in conducting surveys can introduce error or bias into the findings of public opinion polls.
As you know, our federal government is made up of three branches: an Executive branch, headed by the President: a Judicial branch, headed by the U.S. Supreme Court: and a Legislative branch, made up of the U.S. Senate and House of Representatives. First, let me ask you how much trust and confidence you have at this time in the Executive branch headed by the President, the Judicial branchheaded by the US Supreme Court, and the Legislative branch, consisting of the US Senate and House of Representatives-- a great deal, a fair amount, not very much, or none at all?
A. The Executive branch headed by the President
|
Great |
Fair |
Not very |
None |
No |
|
|
% |
% |
% |
% |
% |
|
|
2002 Sep 5-8 |
28 |
44 |
20 |
7 |
1 |
|
2001 Sep 7-10 |
21 |
42 |
28 |
8 |
1 |
|
2000 Jul 6-9 |
18 |
47 |
23 |
11 |
1 |
|
1999 Feb 4-8 |
21 |
43 |
24 |
11 |
1 |
|
1998 Dec 28-29 |
24 |
39 |
23 |
12 |
2 |
|
1997 May 30-Jun 1 |
13 |
49 |
27 |
9 |
2 |
|
1976 Jun |
13 |
45 |
30 |
9 |
4 |
|
1974 Apr |
12 |
28 |
36 |
20 |
3 |
|
1972 May |
24 |
49 |
20 |
4 |
2 |
B. The Judicial branch, headed by the U.S. Supreme Court
|
Great |
Fair |
Not very |
None |
No |
|
|
% |
% |
% |
% |
% |
|
|
2002 Sep 5-8 |
17 |
58 |
18 |
5 |
2 |
|
2001 Sep 7-10 |
17 |
57 |
20 |
4 |
2 |
|
2000 Jul 6-9 |
23 |
52 |
18 |
6 |
1 |
|
1999 Feb 4-8 |
29 |
51 |
13 |
5 |
2 |
|
1998 Dec 28-29 |
27 |
51 |
16 |
4 |
2 |
|
1997 May 30-Jun 1 |
19 |
52 |
22 |
5 |
2 |
|
1976 Jun |
16 |
47 |
26 |
6 |
4 |
|
1974 Apr |
17 |
54 |
20 |
5 |
5 |
|
1972 May |
17 |
49 |
24 |
7 |
4 |
C. The Legislative branch, consisting of the U.S. Senate and House of Representatives
|
Great |
Fair |
Not very |
None |
No |
||||||
|
% |
% |
% |
% |
% |
||||||
|
2002 Sep 5-8 |
9 |
58 |
26 |
6 |
1 |
|||||
|
2001 Sep 7-10 |
7 |
58 |
28 |
6 |
1 |
|||||
|
2000 Jul 6-9 |
11 |
57 |
24 |
7 |
1 |
|||||
|
1999 Feb 4-8 |
8 |
49 |
34 |
7 |
2 |
|||||
|
1998 Dec 28-29 |
13 |
48 |
30 |
7 |
2 |
|||||
|
1997 May 30-Jun 1 |
6 |
48 |
36 |
8 |
2 |
|||||
|
1976 Jun |
9 |
52 |
31 |
6 |
4 |
|||||
|
1974 Apr |
13 |
55 |
24 |
4 |
4 |
|||||
|
1972 May |
13 |
58 |
22 |
3 |
3 |
|||||
In general, how much trust and confidence do you have in the mass media -- such as newspapers, T.V. and radio -- when it comes to reporting the news fully, accurately, and fairly -- a great deal, a fair amount, not very much, or none at all?
|
Great |
Fair |
Not very |
None |
No |
|
|
% |
% |
% |
% |
% |
|
|
2002 Sep 5-8 |
10 |
44 |
35 |
11 |
* |
|
2001 Sep 7-10 |
12 |
41 |
33 |
14 |
* |
|
2000 Jul 6-9 |
12 |
39 |
37 |
12 |
* |
|
1999 Feb 4-8 |
11 |
44 |
34 |
11 |
* |
|
1998 Dec 28-29 |
11 |
44 |
35 |
9 |
1 |
|
1997 May 30-Jun 1 |
10 |
43 |
31 |
15 |
1 |
|
1976 Jun |
18 |
54 |
22 |
4 |
2 |
|
1974 Apr |
21 |
48 |
21 |
8 |
2 |
|
1972 May |
18 |
50 |
24 |
6 |
2 |
|
* Less than 0.5% |
|||||
How much trust and confidence do you have in general in men and women in political life in this country who either hold or are running for public office -- a great deal, a fair amount, not very much, or none at all?
|
Great |
Fair |
Not very |
None |
No |
||
|
% |
% |
% |
% |
% |
||
|
2002 Sep 5-8 |
6 |
54 |
33 |
6 |
1 |
|
|
2001 Sep 7-10 ^ |
4 |
51 |
39 |
6 |
* |
|
|
2000 Jul 6-9 |
7 |
57 |
31 |
3 |
2 |
|
|
1998 Dec 28-29 |
7 |
56 |
31 |
4 |
2 |
|
|
1997 May 30-Jun 1 |
5 |
52 |
37 |
5 |
1 |
|
|
1976 Jun |
6 |
58 |
28 |
4 |
4 |
|
|
1974 Apr |
7 |
61 |
24 |
4 |
4 |
|
|
1972 May |
7 |
58 |
27 |
5 |
2 |
|
|
^ |
Asked of a half sample. |
|||||
|
* Less than 0.5% |
||||||
More generally, how much trust and confidence do you have in the American people as a whole when it comes to making judgments under our democratic system about the issues facing our country -- a great deal, a fair amount, not very much, or none at all?
|
Great |
Fair |
Not very |
None |
No |
|
|
% |
% |
% |
% |
% |
|
|
2002 Sep 5-8 |
23 |
55 |
17 |
4 |
1 |
|
2001 Sep 7-10 |
17 |
57 |
22 |
3 |
1 |
|
1976 Jun |
25 |
61 |
12 |
1 |
2 |
|
1974 Apr |
27 |
56 |
13 |
2 |
3 |
