GALLUP NEWS SERVICE
PRINCETON, NJ -- Many political experts expect a close race for control of the U.S. House of Representatives, which the Republican Party currently holds by 12 seats (thus a change of six seats would switch control to the Democrats). The latest CNN/USA Today/Gallup Poll reinforces the notion of a close contest, showing 48% of likely voters favoring the Democratic candidate in their district and 47% favoring the Republican candidate. The economy and Iraq continue to loom as the two major issues on which the campaign will be fought -- half of voters say one of these will be most important to their vote. As expected, those who are most concerned about the economy favor Democrats. But surprisingly, so do those who view Iraq as the top election issue. Support for invading Iraq is lower among the voting public than among the entire adult population.
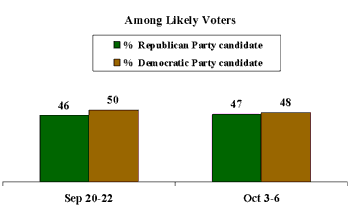
A close contest for control of the House would not only parallel experts' predictions, but also recent history. In each of the last three elections, the nationwide two-party congressional vote was essentially evenly divided between Republican and Democratic candidates. The latest poll, conducted Oct. 3-6 with more than 1,500 adults nationwide, shows that 48% of those deemed most likely to vote say they will vote for the Democratic candidate in their congressional district, and 47% say they prefer the Republican candidate. This represents a slight movement from a Sept. 20-22 poll when Democrats led 50% to 46% among likely voters.
| If the Elections for Congress Were Being Held
Today, Which Party's Candidate Would You Vote for in Your Congressional District? |
 |
Among the larger group of all registered voters, the Democratic lead is slightly larger, at 48% to 43%, and is unchanged from the last poll. Democrats have shown at least a slight lead among registered voters since July.
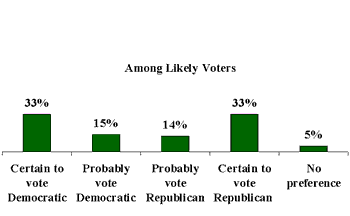
The closeness of the race is underscored when people are asked if they are certain how they will vote on Election Day, or if they could change their minds between now and then. When looking at the results, 33% say they are certain to vote for the Democratic candidate, and 33% say they are certain to vote for the Republican. Fifteen percent indicate they prefer the Democratic candidate but could change their minds, while 14% say this about the Republican candidate. Overall, then, two-thirds of likely voters say they are certain how they will vote, while 34% have not completely made up their minds.
| Vote Intentions in 2002 U.S. House Election |
 |
| Oct 3-6, 2002 |
Democrats Well Positioned on Major Issues
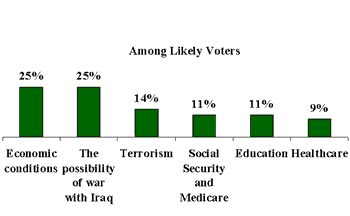
Iraq and the economy still stand as the two major issues of the 2002 election -- half of likely voters say that either of these will be the most important issue to their vote (25% choose the economy and 25% Iraq when given a list of six key issues). Beyond the economy and Iraq, 14% of likely voters say terrorism will be most important to their vote, 11% say education, and 11% say Social Security and Medicare.
| Which One of the Issues is MOST Important? |
 |
| Oct 3-6, 2002 |
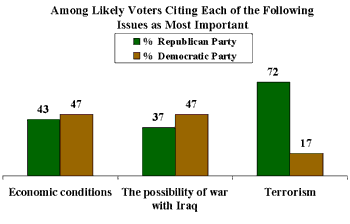
After indicating what issue is most important to them, respondents were asked what party would better handle the issue. Among likely voters who cite the economy as the most important issue, Democrats have a slight lead over Republicans, 47% to 43%. Democrats would seem to benefit politically from the fact that Republican President George W. Bush is presiding over a sluggish economy.
What is more surprising is that the Democratic Party is also viewed as better able to handle the Iraq issue, by a 47% to 37% margin, among likely voters who say this is the most important issue for them. Previous Gallup Polls show that, generally speaking, Republicans tend to be viewed as the party better able to handle international issues (indeed, among likely voters who say terrorism is most important, Republicans lead 72% to 17%).
| Which Party Would Do a Better Job Dealing With the Most Important Issue? |
 |
| Oct 3-6, 2002 |
However, the data suggest the Iraq issue may be starting to work against the Republicans. Overall, support for invading Iraq -- the position favored by President Bush and most Republicans -- fell slightly from 57% in the Sept. 20-22 poll to 53% in the current poll (40% oppose invading Iraq). Likely voters, however, are less likely to support an invasion of Iraq than is the general public. Only 47% of likely voters favor invasion while 46% are opposed. This continues a trend also observed in the Sept. 20-22 poll, when 52% of likely voters favored an invasion of Iraq.
| Favor Invading Iraq With U.S. Ground Troops in an Attempt to Remove Saddam Hussein From Power? |
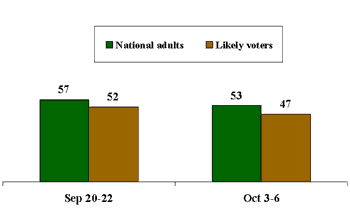 |
What this may suggest is that likely voters are somewhat more cautious in their approach to Iraq, a position that is closer to the Democratic Party's than the Republican Party's.
Impact of Issues Could Be Greater in 2002
In this election, issues may matter more than they have in recent elections. When asked which is more important to them when evaluating congressional candidates, 58% of likely voters say agreement with a candidate's "positions on major national issues" and 35% say the candidate's "ability to do things that help people in your congressional district" (the percentages are 53% and 39%, respectively, among all Americans). Prior to the 1992 and 1994 elections, at least a plurality of Americans said that a candidate's ability to get things done was more important to them.
The new poll also finds that 40% of Americans say it matters a great deal to them which political party controls Congress, a figure that zooms to 57% among likely voters. Thirty-five percent of Americans and 45% of likely voters say their view of Bush will be very important to determining their vote for Congress, while 34% of Americans and 28% of likely voters say it will not be important. Currently, 67% of Americans and 64% of likely voters approve of the job Bush is doing as president.
Survey Methods
These results are based on telephone interviews with a randomly selected national sample of 1,502 adults, 18 years and older, conducted Oct. 3-6, 2002. For results based on this sample, one can say with 95 percent confidence that the maximum error attributable to sampling and other random effects is plus or minus 3 percentage points. In addition to sampling error, question wording and practical difficulties in conducting surveys can introduce error or bias into the findings of public opinion polls.
For results based on the sample of 806 likely voters, one can say with 95 percent confidence that the maximum error attributable to sampling and other random effects is plus or minus 4 percentage points.
If the elections for Congress were being held today, which party's candidate would you vote for in your congressional district -- [ROTATE: 1) The Democratic Party's candidate or 2) The Republican Party's candidate]?
As of today, do you lean more toward -- [ROTATE: 1) The Democratic Party's candidate or 2) The Republican Party's candidate]?
|
Democratic |
Republican |
Undecided/ |
|
|
% |
% |
% |
|
|
Likely Voters |
|||
|
2002 Oct 3-6 |
48 |
47 |
5 |
|
2002 Sep 20-22 |
50 |
46 |
4 |
|
Registered Voters |
|||
|
2002 Oct 3-6 |
48 |
43 |
9 |
|
2002 Sep 20-22 |
48 |
43 |
9 |
|
2002 Sep 2-4 |
46 |
43 |
11 |
|
2002 Aug 19-21 |
50 |
42 |
8 |
|
2002 Jul 26-28 |
48 |
42 |
10 |
|
2002 Jun 28-30 |
44 |
49 |
7 |
|
2002 Jun 21-23 |
50 |
42 |
8 |
|
2002 May 28-29 |
45 |
46 |
9 |
|
2002 Apr 29-May 1 |
48 |
44 |
8 |
|
2002 Apr 5-7 |
50 |
43 |
7 |
|
2002 Mar 22-24 |
46 |
46 |
8 |
|
2002 Feb 8-10 |
43 |
47 |
10 |
|
2002 Jan 25-27 |
44 |
46 |
10 |
|
2002 Jan 11-14 |
43 |
46 |
11 |
|
2001 Dec 14-16 |
43 |
48 |
9 |
|
2001 Nov 2-4 |
45 |
45 |
10 |
|
2001 Jun 8-10 |
49 |
45 |
6 |
|
National Adults |
|||
|
2002 Oct 3-6 |
47 |
41 |
12 |
|
2002 Sep 20-22 |
48 |
41 |
11 |
|
2002 Sep 2-4 |
45 |
40 |
15 |
|
2002 Aug 19-21 |
49 |
41 |
10 |
|
2002 Jul 26-28 |
47 |
40 |
13 |
|
2002 Jun 28-30 |
44 |
46 |
10 |
|
2002 Jun 21-23 |
48 |
40 |
12 |
|
2002 May 28-29 |
44 |
45 |
11 |
|
2002 Apr 29-May 1 |
47 |
43 |
10 |
|
2002 Apr 5-7 |
50 |
40 |
10 |
|
2002 Mar 22-24 |
45 |
43 |
12 |
|
2002 Feb 8-10 |
42 |
44 |
14 |
|
2002 Jan 25-27 |
45 |
44 |
11 |
|
2002 Jan 11-14 |
44 |
44 |
12 |
|
2001 Dec 14-16 |
44 |
46 |
10 |
|
2001 Nov 2-4 |
43 |
44 |
13 |
|
2001 Jun 8-10 |
50 |
43 |
7 |
Would you say you will definitely vote for the [Republican (or) Democrat], or is it possible you would change your mind between now and the election?
|
Certain |
Probably vote Democratic |
Probably vote Republican |
Certain |
Voting |
|
|
|
% |
% |
% |
% |
% |
% |
|
|
Likely Voters |
||||||
|
2002 Oct 3-6 |
33 |
15 |
14 |
33 |
* |
5 |
|
Registered Voters |
||||||
|
2002 Oct 3-6 |
27 |
21 |
16 |
27 |
1 |
8 |
|
2002 May 28-29 |
23 |
22 |
24 |
22 |
1 |
8 |
|
National Adults |
||||||
|
2002 Oct 3-6 |
26 |
21 |
17 |
24 |
1 |
11 |
|
2002 May 28-29 |
21 |
23 |
24 |
21 |
1 |
10 |
Thinking about the elections for Congress this November, which ONE of the following issues is MOST important to you when you think about your vote for Congress this year -- [ROTATED: economic conditions, education, healthcare, the possibility of war with Iraq, Social Security and Medicare, (or) terrorism]?
|
National Adults |
Likely Voters |
|
|
% |
% |
|
|
Economic conditions |
25 |
25 |
|
The possibility of war with Iraq |
24 |
25 |
|
Terrorism |
14 |
14 |
|
Social Security and Medicare |
12 |
11 |
|
Education |
11 |
11 |
|
Healthcare |
9 |
9 |
|
OTHER (vol.) |
2 |
2 |
|
NONE (vol.) |
1 |
1 |
|
No opinion |
2 |
2 |
Do you think the Republicans in Congress or the Democrats in Congress would do a better job of dealing with this issue?
BASED ON --1,463-- NATIONAL ADULTS AND --783-- LIKELY VOTERS WHO IDENTIFIED AN ISSUE AS MOST IMPORTANT TO THEIR VOTE IN THE ELECTIONS THIS NOVEMBER
|
|
|
NO DIFFERENCE (vol.) |
No opinion |
|
|
National Adults |
||||
|
2002 Oct 3-6 |
37% |
40 |
11 |
12 |
|
Likely Voters |
||||
|
2002 Oct 3-6 |
41% |
42 |
10 |
7 |
|
National Adults |
||||
|
|
|
No Difference (Vol.) |
|
|
|
% |
% |
% |
% |
|
|
Economic conditions |
38 |
43 |
12 |
7 |
|
Education |
32 |
49 |
11 |
8 |
|
Healthcare |
29 |
44 |
15 |
12 |
|
The possibility of war with Iraq |
37 |
43 |
9 |
11 |
|
Social Security/Medicare |
26 |
44 |
13 |
17 |
|
Terrorism |
55 |
21 |
8 |
16 |
|
BASED ON --393-- NATIONAL ADULTS (MoE = ±5%) NAMING ECONOMIC CONDITIONS AS THE MOST IMPORTANT ISSUE TO THEIR VOTE |
||||
|
BASED ON --164-- NATIONAL ADULTS (MoE = ±8%) NAMING EDUCATION AS MOST IMPORTANT ISSUE. |
||||
|
BASED ON --137-- NATIONAL ADULTS (MoE = ±9%) NAMING HEALTHCARE AS MOST IMPORTANT ISSUE. |
||||
|
BASED ON --369-- NATIONAL ADULTS (MoE = ±6%) NAMING THE POSSIBILITY OF WAR WITH IRAQ AS THE MOST IMPORTANT ISSUE |
||||
|
BASED ON --166-- NATIONAL ADULTS (MoE = ±8%) NAMING SOCIAL SECURITY/MEDICARE AS MOST IMPORTANT ISSUE. |
||||
|
BASED ON --213-- NATIONAL ADULTS (MoE = ±7%) NAMING TERRORISM AS THE MOST IMPORTANT ISSUE |
||||
|
Likely Voters |
||||
|
|
|
NO DIFFERENCE (Vol.) |
|
|
|
Economic conditions |
43% |
47 |
9 |
1 |
|
Education |
SMALL SAMPLE SIZES |
|||
|
Healthcare |
SMALL SAMPLE SIZE |
|||
|
The possibility of war with Iraq |
37% |
47 |
8 |
8 |
|
Social Security/Medicare |
SMALL SAMPLE SIZES |
|||
|
Terrorism |
72% |
17 |
1 |
10 |
|
BASED ON --219-- LIKELY VOTERS (MoE = ±7%) NAMING ECONOMIC CONDITIONS AS MOST IMPORTANT ISSUE. |
||||
|
BASED ON --215-- LIKELY VOTERS (MoE = ±7%) NAMING THE POSSIBILITY OF WAR WITH IRAQ AS MOST IMPORTANT ISSUE. |
||||
|
BASED ON --111-- LIKELY VOTERS (MoE = ±10%) NAMING TERRORISM AS MOST IMPORTANT ISSUE. |
||||
When you vote for a candidate for the House of Representatives, which is more important to you -- [ROTATED: his or her ability to do things that help people in your congressional district, (or) that you agree with his or her positions on major national issues]?
|
|
Agree with positions |
|
|
|
|
% |
% |
% |
% |
|
|
National Adults |
||||
|
2002 Oct 3-6 |
39 |
53 |
5 |
3 |
|
2002 Apr 5-7 |
45 |
48 |
5 |
2 |
|
1994 Oct 22-25 |
52 |
36 |
10 |
2 |
|
1992 Apr 22-24 |
47 |
41 |
9 |
3 |
|
Likely Voters |
||||
|
2002 Oct 3-6 |
35 |
58 |
6 |
1 |
|
1994 Oct 22-25 |
46 |
42 |
11 |
1 |
How much does it matter to you which political party controls Congress -- a great deal, a moderate amount, not much, or not at all?
BASED ON --752-- NATIONAL ADULTS
BASED ON --400-- LIKELY VOTERS
|
|
Moderate amount |
|
|
No opinion |
|
|
National Adults |
|||||
|
2002 Oct 3-6 |
40% |
30 |
18 |
10 |
2 |
|
Likely Voters |
|||||
|
2002 Oct 3-6 |
57% |
24 |
13 |
5 |
1 |
* -- Less than 0.5%
