GALLUP NEWS SERVICE
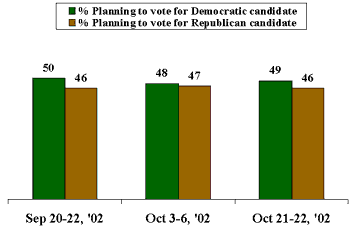
PRINCETON, NJ -- The latest CNN/USA Today/Gallup Poll on the race for control of the House of Representatives shows Democrats continuing to have a slight edge over Republicans. The "generic" congressional ballot shows that 49% of likely voters say they will vote for the Democratic candidate in their district, and 46% will vote for the Republican. This result is in line with recent Gallup Polls showing a very close race among likely voters, with Democrats having a slight advantage. Gallup's predictive model of the congressional vote suggests that a three-point Democratic lead in the popular vote -- if sustained through Election Day -- could be enough for Democrats to gain control of the House of Representatives.
The poll, conducted Oct. 21-22, shows the Democrats maintaining a slight edge among likely voters, 49% to 46%. However, that 3-point lead is within the poll's margin of error (±4 points), so the final outcome is essentially too close to call.
| Congressional Generic Ballot Trend: Among Likely Voters |
 |
Among registered voters, the Democratic lead is 9 points, 50% to 41%. The difference between the likely and registered voter results underscores the importance of turnout in the elections. Republicans are typically more likely to turn out to vote than are Democrats, and that advantage helps to overcome the Democratic advantage in vote preference among the larger populations of registered voters and national adults. Both parties will go to great lengths to mobilize voters in the days leading up to the elections, hoping to propel themselves to victory.
A nearly equal proportion of likely voters say they are certain they will vote for the Democratic (31%) or the Republican (32%) candidate. Eighteen percent of Democratic voters say they could change their mind, as do 14% of Republican voters.
Independent Voters Tilting Democratic
The last three congressional elections have seen the two-party vote split evenly among the Republican and Democratic parties. This is underscored by the fact that 38% of likely voters say they usually, almost always, or always vote Republican for offices other than president; 37% say they usually, almost always, or always vote Democratic; and 23% say they vote about equally for both parties.
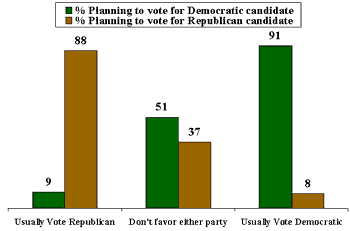
Among these partisan voters, the vast majority are remaining loyal to their party -- 88% of likely voters who generally support Republican candidates say they will vote for the Republican candidate in their district (9% are defecting to the Democratic candidate) and 91% of voters who normally vote Democratic are supporting the Democratic candidate in their district (8% are defecting). Among likely voters who say they generally do not favor either party when voting, 51% say they will vote for the Democratic candidate and 37% for the Republican.
| Congressional Generic Ballot Trend: By Voting History |
 |
| Likely Voters -- Oct 21-22, 2002 |
Gallup Predictive Model Suggests Democratic Majority Possible
The generic ballot has proved to be a very good predictor of the nationwide vote for the U.S. House. Given that the national vote is strongly related to the percentage of seats each party holds after the elections, the generic ballot can be used to help predict which party would have a House majority following the elections.
The model assesses the historical relationship between the two-party House vote and the partisan share of seats in the House after each midterm election dating back to 1946. The model predicts that the Democratic Party would need just over a 2-point advantage in the national two-party vote over the Republican Party in order to gain control of the House. The 2-point edge is necessitated by the fact that Republicans currently hold majority-party status in the House.
The latest generic ballot shows a 3-point Democratic edge, which the model predicts would result in 221 Democratic seats and 214 Republican seats in the House of Representatives.
Most Voters Expect Competitive Races
Despite some experts' projections of very few competitive House races, 50% of likely voters nationwide say that both candidates in their congressional district have a good chance of winning. More (25%) say the Republican is almost certain to win in their district than say the Democrat will probably win (17%).
Not surprisingly, these results are colored by a person's voting intention. Among likely voters who say they will vote for the Democratic candidate, 28% say the Democrat is certain to win, 15% say the Republican, and 47% say both candidates have a good chance of winning. Among likely voters who are planning to support the Republican candidate, 35% say the Republican is the probable winner, only 6% say the Democrat, and 54% say both candidates could win.
Survey Methods
These results are based on telephone interviews with a randomly selected national sample of 1,018 national adults, and 550 likely voters, 18 years and older, conducted Oct. 21-22, 2002. For results based on the sample of national adults, one can say with 95 percent confidence that the maximum error attributable to sampling and other random effects is ±3 percentage points. For results based on the sample of likely voters, one can say with 95 percent confidence that the maximum error attributable to sampling and other random effects is ±4 percentage points. In addition to sampling error, question wording and practical difficulties in conducting surveys can introduce error or bias into the findings of public opinion polls.
If the elections for Congress were being held today, which party's candidate would you vote for in your Congressional district -- [ROTATE: 1) The Democratic Party's candidate or 2) The Republican Party's candidate]?
As of today, do you lean more toward -- [ROTATE: 1) The Democratic Party's candidate or 2) The Republican Party's candidate]?
|
|
Democratic |
Republican |
Undecided/ |
|
% |
% |
% |
|
|
Likely Voters |
|||
|
2002 Oct 21-22 |
49 |
46 |
5 |
|
2002 Oct 3-6 |
48 |
47 |
5 |
|
2002 Sep 20-22 |
50 |
46 |
4 |
|
Registered Voters |
|||
|
2002 Oct 21-22 |
50 |
41 |
9 |
|
2002 Oct 3-6 |
48 |
43 |
9 |
|
2002 Sep 20-22 |
48 |
43 |
9 |
|
2002 Sep 2-4 |
46 |
43 |
11 |
|
2002 Aug 19-21 |
50 |
42 |
8 |
|
2002 Jul 26-28 |
48 |
42 |
10 |
|
2002 Jun 28-30 |
44 |
49 |
7 |
|
2002 Jun 21-23 |
50 |
42 |
8 |
|
2002 May 28-29 |
45 |
46 |
9 |
|
2002 Apr 29-May 1 |
48 |
44 |
8 |
|
2002 Apr 5-7 |
50 |
43 |
7 |
|
2002 Mar 22-24 |
46 |
46 |
8 |
|
2002 Feb 8-10 |
43 |
47 |
10 |
|
2002 Jan 25-27 |
44 |
46 |
10 |
|
2002 Jan 11-14 |
43 |
46 |
11 |
|
2001 Dec 14-16 |
43 |
48 |
9 |
|
2001 Nov 2-4 |
45 |
45 |
10 |
|
2001 Jun 8-10 |
49 |
45 |
6 |
|
National Adults |
|||
|
2002 Oct 21-22 |
48 |
40 |
12 |
|
2002 Oct 3-6 |
47 |
41 |
12 |
|
2002 Sep 20-22 |
48 |
41 |
11 |
|
2002 Sep 2-4 |
45 |
40 |
15 |
|
2002 Aug 19-21 |
49 |
41 |
10 |
|
2002 Jul 26-28 |
47 |
40 |
13 |
|
2002 Jun 28-30 |
44 |
46 |
10 |
|
2002 Jun 21-23 |
48 |
40 |
12 |
|
2002 May 28-29 |
44 |
45 |
11 |
|
2002 Apr 29-May 1 |
47 |
43 |
10 |
|
2002 Apr 5-7 |
50 |
40 |
10 |
|
2002 Mar 22-24 |
45 |
43 |
12 |
|
2002 Feb 8-10 |
42 |
44 |
14 |
|
2002 Jan 25-27 |
45 |
44 |
11 |
|
2002 Jan 11-14 |
44 |
44 |
12 |
|
2001 Dec 14-16 |
44 |
46 |
10 |
|
2001 Nov 2-4 |
43 |
44 |
13 |
|
2001 Jun 8-10 |
50 |
43 |
7 |
SELECTED GENERIC BALLOT TREND
|
Democratic |
Republican |
Undecided/ |
|
|
% |
% |
% |
|
|
1998 Mid-Term Elections |
|||
|
1998 Oct 29-Nov 1 |
49 |
45 |
6 |
|
1998 Oct 23-25 |
47 |
49 |
4 |
|
1998 Oct 9-12 |
47 |
46 |
6 |
|
1998 Sep 23-24 |
51 |
45 |
4 |
|
1998 Sep 14-15 |
48 |
47 |
5 |
|
1998 Sep 11-12 |
47 |
46 |
7 |
|
1998 Aug 21-23 |
44 |
48 |
8 |
|
1998 Jul 7-8 |
46 |
46 |
8 |
|
1998 Apr 17-19 |
44 |
50 |
6 |
|
Likely Voters |
|||
|
Final Mid-Term Elections |
|||
|
1998 Oct 29-Nov 1 |
49 |
45 |
6 |
|
1994 Nov 2-6 |
44 |
51 |
5 |
|
1990 Oct 25-28 |
54 |
46 |
-- |
|
1982 Oct 15-18 |
55 |
45 |
-- |
|
1978 Oct 27-30 |
55 |
45 |
-- |
|
1974 Oct 18-21 |
54 |
35 |
11 |
|
1970 Oct 22-25 |
53 |
47 |
-- |
|
1966 Oct 1-6 |
52 |
48 |
-- |
|
1962 Oct 11-16 |
58 |
42 |
-- |
|
1958 Oct 15-20 |
58 |
42 |
-- |
|
1954 Oct 15-20 |
52 |
48 |
-- |
|
1950 Oct 1-6 |
51 |
49 |
-- |
|
Registered Voters |
|||
|
Final Mid-Term Elections |
|||
|
1998 Oct 29-Nov 1 |
50 |
41 |
9 |
|
1994 Nov 2-6 |
46 |
46 |
8 |
|
1990 Oct 25-28 |
50 |
40 |
10 |
|
1982 Oct 15-18 |
58 |
40 |
2 |
|
1978 Oct 27-30 |
55 |
44 |
1 |
|
1974 Oct 18-21 |
62 |
35 |
3 |
|
1970 Oct 22-25 |
46 |
36 |
18 |
|
1966 Oct 21-26 |
51 |
41 |
8 |
|
1962 Oct 19-24 |
56 |
38 |
6 |
|
1958 Oct 15-20 |
56 |
42 |
12 |
|
1954 Oct 15-20 |
-- |
-- |
-- |
|
1950 Oct 22-27 |
47 |
45 |
8 |
Would you say you will definitely vote for the [Republican (or) Democrat], or is it possible you would change your mind between now and the election?
COMBINED RESPONSES (Q.2/Q.3)
|
Certain |
Pro- |
Pro- |
Certain |
Voting |
|
|
|
% |
% |
% |
% |
% |
% |
|
|
Likely Voters |
||||||
|
2002 Oct 21-22 |
31 |
18 |
14 |
32 |
1 |
4 |
|
2002 Oct 3-6 |
33 |
15 |
14 |
33 |
* |
5 |
|
Registered Voters |
||||||
|
2002 Oct 21-22 |
27 |
23 |
16 |
25 |
1 |
8 |
|
2002 Oct 3-6 |
27 |
21 |
16 |
27 |
1 |
8 |
|
2002 May 28-29 |
23 |
22 |
24 |
22 |
1 |
8 |
|
National Adults |
||||||
|
2002 Oct 21-22 |
26 |
22 |
16 |
24 |
1 |
11 |
|
2002 Oct 3-6 |
26 |
21 |
17 |
24 |
1 |
11 |
|
2002 May 28-29 |
21 |
23 |
24 |
21 |
1 |
10 |
|
* Less than 0.5% |
||||||
Regardless of how you plan to vote for Congress, do you think -- [ROTATED: the Republican candidate is almost certain to win, the Democratic candidate is almost certain to win] -- or do you think both parties' candidates have a good chance of winning?
|
Republican |
Democrat |
Both have |
No |
|
|
% |
% |
% |
% |
|
|
Likely Voters |
||||
|
2002 Oct 21-22 |
25 |
17 |
50 |
8 |
|
Registered Voters |
||||
|
2002 Oct 21-22 |
18 |
13 |
59 |
10 |
|
National Adults |
||||
|
2002 Oct 21-22 |
18 |
13 |
58 |
11 |
Thinking about elections for offices other than the president, would you say you -- [ROTATED: always vote Republican, almost always vote Republican, usually vote Republican, vote about equally for both parties, usually vote Democratic, almost always vote Democratic, (or) always vote Democratic]?
|
Vote Republican |
Vote Democratic |
|||||||
|
|
Almost |
Usually |
About |
|
Almost |
|
No |
|
|
% |
% |
% |
% |
% |
% |
% |
% |
|
|
Likely Voters |
||||||||
|
2002 Oct 21-22 |
8 |
16 |
14 |
23 |
11 |
15 |
11 |
2 |
|
Registered Voters |
||||||||
|
2002 Oct 21-22 |
7 |
13 |
13 |
24 |
13 |
16 |
10 |
4 |
|
National Adults |
||||||||
|
2002 Oct 21-22 |
7 |
12 |
12 |
24 |
12 |
15 |
10 |
8 |
