GALLUP NEWS SERVICE
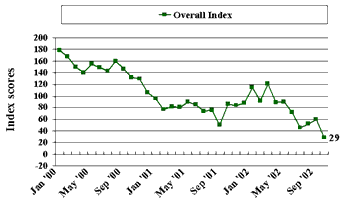
PRINCETON, NJ -- Investor optimism plunged to a new low in October, according to the Index of Investor Optimism -- a joint effort of UBS and The Gallup Organization. The Index is now at 29 -- down 31 points from last month's 60 -- and is at its lowest point since its inception in October 1996. The previous low for the Index was 46 in July of this year.
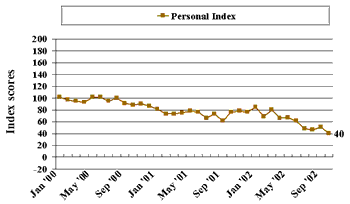
The drop in the Index was driven by declines along both its personal and economic dimensions. The personal dimension hit a new all-time low of 40 in October. The economic dimension turned negative, matching its September 2001 low of –11, indicating that investors are now on average more pessimistic than optimistic about the U.S. economy's prospects over the next 12 months. Importantly, investors are not only less optimistic about the prospects for the stock market in the year ahead, but they are also increasingly pessimistic about future economic growth and the unemployment rate.
Overall Investor Optimism Plunges
Overall investor optimism has fallen steadily since March of this year when it was at 121. In April and May, the Index fell to 89 and 90 respectively. In June, it fell again to 72 before plunging to a six-year low of 46 in July. In August and September, the overall Index increased slightly to 52 and 60 before dropping to a new all-time low of 29 this month.
| Index of Investor Optimism -- U.S. January 2000 to October 2002 |
 |
Personal Dimension Hits New Low
The personal dimension of the Index has also declined steadily since March when it was at 80, falling to 66 in April and 67 in May, then to 61 in June before plunging to 48 and 46 in July and August respectively. In September, the personal dimension of the Index increased modestly to 51 before dropping again to a new low of 40 this month. From an economic outlook perspective, this is the most troubling aspect of the October results. Econometric analysis suggests that the personal dimension of the Index of Investor Optimism is its most predictive dimension.
| Index of Investor Optimism -- U.S. January 2000 to October 2002 |
 |
Economic Dimension Turns Pessimistic
The economic dimension was at 41 in March of this year -- its highest point since October 2000. In April and May, it fell to 23 before dropping to 11 in June. In July, investors turned slightly negative along the economic dimension of the Index as it fell to –2. The economic dimension increased to a +6 in August and then to a +9 in September. In October, the economic dimension plunged once again to –11, matching its all-time low found in September 2001. The economic dimension of the Index suggests that investors are now just as pessimistic about the outlook for the U.S. economy over the next 12 months as they were immediately following the terrorist attacks of 9/11.
| Index of Investor Optimism -- U.S. January 2000 to October 2002 |
 |
Key Points
The 31-point decline in the Index was the result of dimming investor optimism across almost all facets of the Index. Along the economic dimension, investor optimism about future economic growth fell, which accounts for about 7 points of the total decline in the Index. Reduced investor optimism about the stock market accounted for 5 points of the decline, while concerns about the unemployment rate and the inflation rate each contributed another 4 points to the decline.
Along the personal dimension, 7 points of the decline can be attributed to reduced optimism that investors can meet their investment targets for the next 12 months. Another 4 points of the decline resulted from investors being less optimistic that they will be able to maintain or increase their incomes over the next 12 months.
Econometric analysis suggests that the Index of Investor Optimism is a leading economic indicator. The broad nature of its decline during October combines with the weakness shown in Gallup's other economic measures to suggest that the economy is getting substantially weaker just as both the congressional elections and the holiday shopping season approach. Obviously, this is not good news for either political incumbents or the nation's retailers.
|
Impact Of Investor Ratings by Dimension |
|
|
Economic Dimension |
-20 |
|
Economic growth over the next 12 months |
-7 |
|
Unemployment rate over the next 12 months |
-4 |
|
Stock market over the next 12 months |
-5 |
|
Inflation over the next 12 months |
-4 |
|
Personal Dimension |
-11 |
|
Ability to meet investment targets over next 12 months |
-7 |
|
Ability to meet investment targets over next 5 years |
0 |
|
Ability to maintain or increase income over next 12 months |
-4 |
Survey Methods
Results are based on telephone interviews with 1,001 investors, aged 18+, conducted Oct. 1 to 17, 2002. For results based on the total sample of investors, one can say with 95% confidence that the margin of sampling error is ± 3 percentage points.

