A person's party identification is generally the most powerful predictor of his or her political behavior. As such, Gallup asks respondents in every poll, "As of today, do you consider yourself a Republican, a Democrat, or an independent?" Those who do not identify as a Republican or Democrat are asked toward which party they lean. The notion of a partisan "leaner" is extremely meaningful from a political perspective, as Americans who are independent but lean toward one of the parties usually vote for that party.
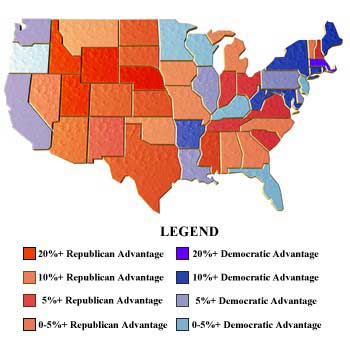
An analysis of Gallup Polls conducted in 2002* provides the basis for estimating the political party identification of the residents in each of the 48 contiguous states and the District of Columbia (Hawaii and Alaska are not included in Gallup's national polling). In 28 states, more residents identified themselves as Republicans than Democrats, while in 20 states and the District of Columbia more identified themselves as Democrats than Republicans. Even so, the fact Democrats have advantages in some of the more populous states means that the national partisanship figures are essentially even. Wyoming is the most heavily Republican state and Massachusetts is the most Democratic. However, the nation's capital, Washington, D.C., is overwhelmingly Democratic, exceeding Massachusetts by a considerable amount. A comparison of 2002 results to 1993 Gallup Poll data reveals that in most states the party identification of residents has shifted in favor of the GOP.
Measuring Party ID
Gallup's party identification analysis for 2002 is based on aggregated data from nearly 45,000 interviews from 44 different telephone surveys conducted throughout the year. Across all these surveys, 33% of Americans identified as Republicans, 32% as Democrats, and 34% as independents. When the leanings of independents are allocated to both major parties, 45.1% of Americans can be considered Republicans and 44.7% Democrats.
These data can be analyzed at the state-level to get a read on the partisan proclivities of each of the contiguous states plus the District of Columbia. Because the percentage of political independents varies greatly by state (ranging from just 22% in Oklahoma to as much as 54% in Rhode Island), it is best to use the total Republican and Democratic figures (including partisan leaners) to compare states.
State Party Identification in 2002
Gallup's 2002 polling aggregate shows that 28 states had a greater percentage of Republicans and Republican leaners than Democrats and Democratic leaners, and 20 states and the District of Columbia had a greater percentage of Democrats and Democratic leaners than Republicans and Republican leaners.
Hawaii and Alaska are not included in Gallup's national polling, but given their states' voting patterns, Hawaii would probably have a Democratic advantage and Alaska a Republican advantage, yielding 29 Republican and 22 Democratic states in 2002. Given the closeness of the national partisanship figures, it is clear that the Republican advantage in number of states is offset by the fact that some of the most heavily populated states, such as California, New York, Pennsylvania, and Illinois, tilt Democratic.
The following table gives a more detailed account of the states in terms of the difference in Republican and Democratic identifiers (with leaners allocated to the appropriate party). Positive numbers indicate a Republican advantage and negative numbers indicate a Democratic advantage.
The noncoastal Western region of the country appears to be a Republican stronghold -- the states with the biggest Republican advantages are Wyoming, Utah, Idaho, Arizona, Nebraska, and Mississippi. Wyoming has three Republican identifiers and leaners for every one Democrat, and Utah has two Republicans for every one Democrat. More than six in 10 residents in Wyoming, Idaho, and Utah are Republican/Republican leaners, and 10 states have 50% or more Republicans/Republican leaners.
Six states and the District of Columbia have 50% or more Democrats/Democratic leaners. Most are located in the Northeast -- the most Democratic states are Massachusetts, Maryland, Arkansas, and New York. The District of Columbia is the most politically uncompetitive locality looked at, with 85% of its residents identifying as Democrats and only 13% as Republicans.
Eight states are closely divided in their partisan leanings, having less than a two-percentage point difference in the percentage of Republicans and Democrats residing in the state. These include Iowa, Florida, Vermont, Oklahoma, Michigan, Kentucky, Minnesota, and Missouri. These data show Iowa to be the most evenly divided state. In more than 1,000 interviews conducted with Iowans in 2002 Gallup Polls, 44.0% identify as Republicans or lean Republican and 43.8% identify as Democrats or lean Democratic.
Independent-Minded States
As mentioned above, the proportion of people who identified as political independents in 2002 (including those who subsequently said they lean toward one of the parties) varied greatly by state. The tendency to think of oneself as an independent is greater in the Northeast than anywhere else. A majority of those living in Rhode Island and Massachusetts said they were political independents. However, many of the political independents in Rhode Island, Massachusetts, and Connecticut say they lean toward the Democratic Party and those states typically vote Democratic for president and U.S. Senate.
At the other end of the spectrum, less than one quarter of those living in Oklahoma (22.3%), Kentucky (24.8%), and Pennsylvania (24.9%) are political independents. It is harder to characterize the states with lower proportions of independents, as they come from different parts of the country -- Oklahoma, North Carolina, and Louisiana in the South; Pennsylvania and the District of Columbia in the mid-Atlantic region; Nebraska and Kansas in the Midwest; and Wyoming in the West.
Change Over Time
While residents in specific states tend to reliably support one party over time, change can and does occur. The most dramatic example of this in recent years has occurred in the South, which used to vote overwhelmingly Democratic but now for the most part supports Republican candidates. Even though Southerners have traditionally identified as Democrats, the region has tended to be ideologically conservative, and over time the Republican Party has gained considerable influence in the South. Migration patterns to and from specific states also can play a role in those states' political leanings. Also, specific political effects (such as George W. Bush's overwhelming popularity in 2002) can cause short-term partisanship changes.
Gallup data show that there has been much change in state-specific partisanship since 1993. At that time, 35 states (plus the District of Columbia) showed at least a slight Democratic edge, while just 13 tilted toward the Republicans. A comparison of these findings to the current data shows a net shift of 15 states toward the Republican Party in the last 10 years. This reflects the fact that throughout much of 2002 Gallup Polls showed more Americans identifying as Republicans than as Democrats, a change from the more typical finding over the last decade that the Democratic Party had at least a slight edge over the Republicans among the general population. Indeed since 1990, Republicans have only had an advantage in party ID two years, 2002 and 1991, when success in the Persian Gulf War made the elder George Bush extremely popular among Americans.
As today, Wyoming had the biggest Republican advantage of any state in 1993. Kansas, Idaho, Nebraska, Utah, and Nevada were also among the most heavily Republican states. Note that with the exception of South Carolina, every Southern state had more Democrats than Republicans in 1993. The most Democratic states at that time included the District of Columbia, Louisiana, West Virginia, Minnesota, Massachusetts, and Maryland. The most competitive states in 1993 were Colorado, South Carolina, Montana, Virginia, Florida, South Dakota, and New Mexico.
Comparing the data from 1993 and 2002 gives a sense of which states have become more Republican and which have become more Democratic over the last 10 years. The following table shows the change in the partisan advantages between 1993 and 2002. Positive numbers indicate that the Republicans have made gains in relation to the Democrats, while negative numbers indicate that Democrats have made gains in relation to the Republicans. For example, in 1993, Democrats had a 10-point edge over Republicans in Ohio. By 2002, the Republicans had gained an edge of 8.5 points, for a net shift of 18.5 points to the Republican Party.
Only seven states plus the District of Columbia became more Democratic in political orientation between 2002 and 1993: Maine, New Jersey, Connecticut, Kansas, Vermont, Arkansas, and Nevada. Conversely, 41 states have seen Republican gains, including all of the Southern states except for Arkansas. The states that have seen the largest movement toward Republicans include Utah, Mississippi, Louisiana, Wyoming, Minnesota, and Missouri. Maryland, Washington, Massachusetts, Nevada, and Florida have shown the least change in partisanship since 1993.
*Results for 2002 are based on telephone interviews with 44,889 national adults from randomly selected national samples of adults, aged 18 years older, conducted in 2002. Results for 1993 are based on telephone interviews with 27,319 national adults from randomly selected national samples of adults, aged 18 and older, conducted in 1993. For results based on an individual state, the maximum error attributable to sampling and other random effects varies, from a low of plus or minus 2 percentage points in California to a high of plus or minus 13 percentage points in Washington, D.C. In addition to sampling error, question wording and practical difficulties in conducting surveys can introduce error or bias into the findings of public opinion polls.
