GALLUP NEWS SERVICE
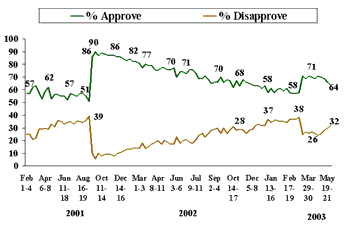
PRINCETON, NJ -- The latest CNN/USA Today/Gallup poll shows the American public is evenly divided in its view as to whether the latest round of tax cuts will help the economy. Relatively few Americans, though, say that the tax cuts will help their families' financial situations, although the percentage is higher among wealthier Americans. The public is also divided as to whether tax cuts are a good or bad idea at this time. President George W. Bush's job approval rating remains strong at 64%, but is slightly lower than the previous May reading, continuing a gradual decline from the high of 71% recorded during the Iraq war.
The new poll, conducted May 30-June 1, finds 47% of Americans saying the $350 billion tax cuts that Bush signed into law last week were a good idea at this time, while 43% say they were a bad idea. Bush's signing the bill into law apparently did little to change Americans' views on the tax cuts -- the last poll conducted prior to the May 28 signing showed a very similar 45% saying they were a good idea and 46% saying bad idea.
Americans are evenly divided in their views, with 47% on both sides, on whether the tax cuts will or will not help the U.S. economy. Opinion is strongly, and predictably, related to one's party affiliation. Seventy-five percent of Republicans say the tax cuts will help the economy, and 73% of Democrats say they will not help. Independents divide about evenly, with 46% saying the tax cuts will benefit the economy and 48% saying they will not.
Beyond partisanship, Americans with lower levels of education are more optimistic about the tax cut's impact on the economy than are those with higher levels of education. A slight majority of non-college graduates, 51%, believe the tax cuts will benefit the economy, while 42% believe they will not. But among Americans who have graduated from college, just 34% think the tax cuts will help the economy, while 60% believe they will not.
Most Americans Do Not Expect Tax Cuts to Help Their Families
Relatively few Americans, 35%, say the tax cuts will help their families' financial situations, while 56% say they will not. Again, Americans' views are strongly influenced by their partisanship, but among all partisan groups, fewer say the tax cuts will help their families than say they will help the U.S. economy. Fifty-seven percent of Republicans expect the tax cuts to benefit their financial situations, compared with 37% of independents and 12% of Democrats.
The tax cut has been controversial because it will reduce taxes that investors pay on dividends from stocks they own. The expectation is that this provision will mainly benefit wealthier Americans. In fact, the data show a sharp contrast in opinion by income at the $30,000 household income level. Forty-three percent of Americans whose annual household incomes are $30,000 or above expect the tax cut will benefit their families, compared with only 23% of those whose household incomes are less than $30,000. There are also slight educational differences, with college graduates more likely to expect that the tax cuts will benefit their families (45%) than those without a college degree (32%).
Bush Job Approval Continues Gradual Decline From Wartime High
Bush's job approval rating is at 64%, and continues to show a drop-off from the wartime levels of about 70%. Decline from the war levels was first evident in mid-May, at which time 66% of Americans approved of Bush. From a historical perspective, the 64% approval rating is above average, as the average Gallup approval rating for presidents dating back to Franklin D. Roosevelt is 56%.
| George W. Bush's Job Approval Rating |
 |
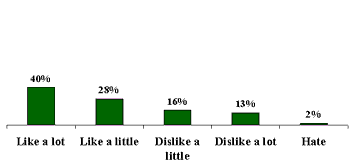
The poll also asked respondents for their personal views of Bush, and finds that most Americans have a favorable impression. Sixty-eight percent of Americans say they like the president, including 40% who "like him a lot." Thirty-one percent of Americans say they dislike him, including 13% who "dislike him a lot" and 2% who say they "hate Bush."
| Opinion of George W. Bush |
 |
Survey Methods
These results are based on telephone interviews with a randomly selected national sample of 1,019 adults, aged 18 and older, conducted May 30-June 1, 2003. For results based on this sample, one can say with 95% confidence that the maximum error attributable to sampling and other random effects is ±3 percentage points. In addition to sampling error, question wording and practical difficulties in conducting surveys can introduce error or bias into the findings of public opinion polls.
Do you approve or disapprove of the way George W. Bush is handling his job as president?
|
Approve |
Disapprove |
No opinion |
|
|
% |
% |
% |
|
|
2003 |
|||
|
(NA) 2003 May 30-Jun 1 |
64 |
32 |
4 |
|
(NA) 2003 May 19-21 |
66 |
30 |
4 |
|
(NA) 2003 May 5-7 |
69 |
28 |
3 |
|
(NA) 2003 Apr 22-23 |
70 |
26 |
4 |
|
(NA) 2003 Apr 14-16 |
71 |
24 |
5 |
|
(NA) 2003 Apr 7-9 |
69 |
26 |
5 |
|
(NA) 2003 Apr 5-6 |
70 |
27 |
3 |
|
(NA) 2003 Mar 29-30 |
71 |
26 |
3 |
|
(NA) 2003 Mar 24-25 |
69 |
27 |
4 |
|
(NA) 2003 Mar 22-23 |
71 |
25 |
4 |
|
(NA) 2003 Mar 14-15 |
58 |
38 |
4 |
|
(NA) 2003 Mar 3-5 |
57 |
37 |
6 |
|
(NA) 2003 Feb 24-26 |
57 |
37 |
6 |
|
(NA) 2003 Feb 17-19 |
58 |
37 |
5 |
|
(NA) 2003 Feb 7-9 |
61 |
34 |
5 |
|
(NA) 2003 Feb 3-6 |
59 |
35 |
6 |
|
(NA) 2003 Jan 31-Feb 2 |
61 |
35 |
4 |
|
(NA) 2003 Jan 23-25 |
60 |
36 |
4 |
|
(NA) 2003 Jan 20-22 |
58 |
36 |
6 |
|
(NA) 2003 Jan 13-16 |
61 |
34 |
5 |
|
(NA) 2003 Jan 10-12 |
58 |
37 |
5 |
|
(NA) 2003 Jan 3-5 |
63 |
32 |
5 |
|
2002 |
|||
|
(NA) 2002 Dec 19-22 |
61 |
32 |
7 |
|
(NA) 2002 Dec 16-17 |
63 |
33 |
4 |
|
(NA) 2002 Dec 9-10 |
63 |
32 |
5 |
|
(NA) 2002 Dec 5-8 |
64 |
29 |
7 |
|
(NA) 2002 Nov 22-24 |
65 |
28 |
7 |
|
(NA) 2002 Nov 11-14 |
66 |
26 |
8 |
|
(NA) 2002 Nov 8-10 |
68 |
27 |
5 |
|
(NA) 2002 Oct 31-Nov 3 |
63 |
29 |
8 |
|
(NA) 2002 Oct 21-22 |
67 |
28 |
5 |
|
(NA) 2002 Oct 14-17 |
62 |
31 |
7 |
|
(NA) 2002 Oct 3-6 |
67 |
28 |
5 |
|
(NA) 2002 Sep 23-26 |
68 |
26 |
6 |
|
(NA) 2002 Sep 20-22 |
66 |
30 |
4 |
|
(NA) 2002 Sep 13-16 |
70 |
26 |
4 |
|
(NA) 2002 Sep 5-8 |
66 |
30 |
4 |
|
(NA) 2002 Sep 2-4 |
66 |
29 |
5 |
|
(NA) 2002 Aug 19-21 |
65 |
28 |
7 |
|
(NA) 2002 Aug 5-8 |
68 |
26 |
6 |
|
(NA) 2002 Jul 29-31 |
71 |
23 |
6 |
|
(NA) 2002 Jul 26-28 |
69 |
26 |
5 |
|
(NA) 2002 Jul 22-24 |
69 |
24 |
7 |
|
(NA) 2002 Jul 9-11 |
73 |
21 |
6 |
|
(NA) 2002 Jul 5-8 |
76 |
18 |
6 |
|
(NA) 2002 Jun 28-30 |
76 |
19 |
5 |
|
(NA) 2002 Jun 21-23 |
73 |
21 |
6 |
|
(NA) 2002 Jun 17-19 |
74 |
20 |
6 |
|
(NA) 2002 Jun 7-8 |
74 |
18 |
8 |
|
(NA) 2002 Jun 3-6 |
70 |
23 |
7 |
|
(NA) 2002 May 28-29 |
77 |
17 |
6 |
|
(NA) 2002 May 20-22 |
76 |
17 |
7 |
|
(NA) 2002 May 6-9 |
76 |
19 |
5 |
|
(NA) 2002 Apr 29-May 1 |
77 |
20 |
3 |
|
(NA) 2002 Apr 22-24 |
77 |
17 |
6 |
|
(NA) 2002 Apr 8-11 |
75 |
20 |
5 |
|
(NA) 2002 Apr 5-7 |
76 |
19 |
5 |
|
(NA) 2002 Mar 22-24 |
79 |
17 |
4 |
|
(NA) 2002 Mar 18-20 |
79 |
16 |
5 |
|
(NA) 2002 Mar 8-9 |
80 |
14 |
6 |
|
(NA) 2002 Mar 4-7 |
77 |
18 |
5 |
|
(NA) 2002 Mar 1-3 |
81 |
14 |
5 |
|
(NA) 2002 Feb 8-10 |
82 |
14 |
4 |
|
(NA) 2002 Feb 4-6 |
82 |
14 |
4 |
|
(NA) 2002 Jan 25-27 |
84 |
13 |
3 |
|
(NA) 2002 Jan 11-14 |
83 |
13 |
4 |
|
(NA) 2002 Jan 7-9 |
84 |
12 |
4 |
|
2001 |
|||
|
(NA) 2001 Dec 14-16 |
86 |
11 |
3 |
|
(NA) 2001 Dec 6-9 |
86 |
10 |
4 |
|
(NA) 2001 Nov 26-27 |
87 |
8 |
5 |
|
(NA) 2001 Nov 8-11 |
87 |
9 |
4 |
|
(NA) 2001 Nov 2-4 |
87 |
9 |
4 |
|
(NA) 2001 Oct 19-21 |
88 |
9 |
3 |
|
(NA) 2001 Oct 11-14 |
89 |
8 |
3 |
|
(NA) 2001 Oct 5-6 |
87 |
10 |
3 |
|
(NA) 2001 Sep 21-22 |
90 |
6 |
4 |
|
(NA) 2001 Sep 14-15 |
86 |
10 |
4 |
|
(NA) 2001 Sep 7-10 |
51 |
39 |
10 |
|
(NA) 2001 Aug 24-26 |
55 |
36 |
9 |
|
(NA) 2001 Aug 16-19 |
57 |
34 |
9 |
|
(NA) 2001 Aug 10-12 |
57 |
35 |
8 |
|
(NA) 2001 Aug 3-5 |
55 |
35 |
10 |
|
(NA) 2001 Jul 19-22 |
56 |
33 |
11 |
|
(NA) 2001 Jul 10-11 |
57 |
35 |
8 |
|
(NA) 2001 Jun 28-Jul 1 |
52 |
34 |
14 |
|
(NA) 2001 Jun 11-17 |
55 |
33 |
12 |
|
(NA) 2001 Jun 8-10 |
55 |
35 |
10 |
|
(NA) 2001 May 18-20 |
56 |
36 |
8 |
|
(NA) 2001 May 10-14 |
56 |
31 |
13 |
|
(NA) 2001 May 7-9 |
53 |
33 |
14 |
|
(NA) 2001 Apr 20-22 |
62 |
29 |
9 |
|
(NA) 2001 Apr 6-8 |
59 |
30 |
11 |
|
(NA) 2001 Mar 26-28 |
53 |
29 |
18 |
|
(NA) 2001 Mar 9-11 |
58 |
29 |
13 |
|
(NA) 2001 Mar 5-7 |
63 |
22 |
15 |
|
(NA) 2001 Feb 19-21 |
62 |
21 |
17 |
|
(NA) 2001 Feb 9-11 |
57 |
25 |
18 |
|
(NA) 2001 Feb 1-4 |
57 |
25 |
18 |
Do you think the tax cuts recently signed into law by George W. Bush were – [ROTATED: a good idea (or) a bad idea] – at this time?
|
Good idea |
Bad idea |
No opinion |
||
|
% |
% |
% |
||
|
2003 May 30-Jun 1 |
47 |
43 |
10 |
|
|
2003 May 19-21 ^ |
45 |
46 |
9 |
|
|
2003 May 5-7 ^ |
52 |
41 |
7 |
|
|
2003 Apr 22-23 ^ |
42 |
47 |
11 |
|
|
^ |
Asked of a half sample. WORDING: Do you think the tax cuts being proposed by George W. Bush are – [ROTATED: a good idea (or) a bad idea] – at this time? |
|||
Q.3-4 SPLIT SAMPLED
Do you think the new tax cut law will – or will not – help your family's financial situation?
BASED ON –514—NATIONAL ADULTS IN FORM A
|
Yes, will |
No, will not |
No opinion |
|
|
2003 May 30-Jun 1 |
35% |
56 |
9 |
Do you think the new tax cut law will – or will not – help the U.S. economy?
BASED ON –505—NATIONAL ADULTS IN FORM B
|
Yes, will |
No, will not |
No opinion |
|
|
2003 May 30-Jun 1 |
47% |
47 |
6 |
How would you describe your overall opinion of George W. Bush? Would you say you – [ROTATED: like Bush a lot, like him a little, dislike him a little, (or) dislike Bush a lot]?
Would you say you hate Bush, or would you say you dislike Bush but do not hate him?
COMBINED RESPONSES (Q.42-43)
|
Like |
Like |
Dislike |
Dislike |
Hate |
No |
|
|
2003 May 30-Jun 1 |
40% |
28 |
16 |
13 |
2 |
1 |
