GALLUP NEWS SERVICE
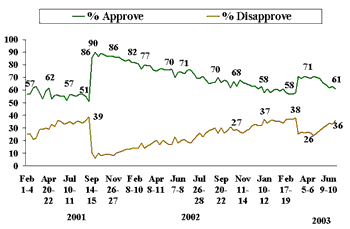
PRINCETON, NJ -- President George W. Bush's job approval rating remains in the low 60s -- about where it has been for the last month. The latest CNN/USA Today/Gallup poll puts the figure at 61%, with 36% saying they disapprove of the job he is doing as president. While Bush's job rating continues to edge downward from its post-Sept. 11 high point -- with the Iraq conflict providing a temporary reversal -- he is still well above the term low of 51% that he reached in the first week of September 2001.
| George W. Bush's Job Approval Rating |
 |
Public support for Bush is now similar to what it was at the start of the year, prior to the military conflict in Iraq that lifted public approval to 71% in March and April. It is also very close to what it was at the 100-day mark of his presidency in 2001, prior to the Sept. 11 attacks that resulted in a rally of public support for him, peaking at 90% in September 2001.
|
George W. Bush Job Approval -- Selected Dates |
|||||
|
"100 days" |
Post Sept. 11 |
Beginning of 2003 |
Iraq war rally |
Today |
|
|
Apr. 20-22, 2001 |
Sep. 21-22, |
Jan. 3-5, |
Apr. 14-16, 2003 |
Jun. 27-29, 2003 |
|
|
Approve |
62% |
90 |
63 |
71 |
61 |
|
Disapprove |
29% |
6 |
32 |
24 |
36 |
Looking into Gallup's historical databank, Bush's current 61% compares favorably with the average approval rating of previous presidents at this stage of their first term. Across the last 10 presidents, from Dwight Eisenhower through Bill Clinton, the average approval rating in the third year of these presidents' first terms was 55%.
Bush Earns Good Marks for Personal Qualities
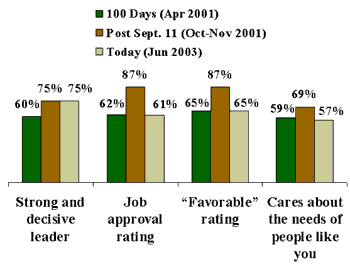
Public perceptions of Bush on a personal level are similar to his overall job rating. The new poll shows that nearly three-quarters of Americans have a generally favorable view of Bush's personal and presidential qualities: 64% agree that he has "the personality and leadership qualities a president should have." This is down from the peak of 79% recorded four months after the Sept. 11 terrorist attacks, but is comparable to Gallup's initial reading on this measure at the start of his presidency.
When asked for their "overall opinion" of Bush, 65% of Americans say they have a favorable opinion of him, identical to the percentage that considers him "honest and trustworthy." Slightly smaller numbers perceive Bush as someone who "cares about the needs of people like you" (57% say this applies) or as "a person you admire" (54%).
The Bush administration has been somewhat on the defensive in recent weeks regarding their pre-war claims about the presence of weapons of mass destruction in Iraq. Nevertheless, Gallup trends suggest that the issue has not damaged Bush's perceived honesty. Perceptions of Bush as honest and trustworthy have dropped slightly since April (from 73% to 65%), but this conforms to a 9-point drop in his overall job rating over this period, and an 8-point drop in the perception that he "cares about the needs of people like you."
Although Bush enjoys solidly positive ratings for his persona, he excels in perceptions of his leadership. Three in four Americans associate Bush with being a "strong and decisive leader." Only 24% disagree with this assessment. And unlike his other performance and personal ratings that have gradually declined since the post-Sept. 11 rally period -- reverting back to pre-Sept. 11 levels -- the belief that Bush is a strong leader is just as high today as it was in October 2001, and remains well above the 60% recorded toward the start of his presidency.
| Key Shifts in Bush Image Ratings |
 |
Where the Rubber Meets the Road
In contrast to the ratings of his persona, perceptions of Bush on more nitty-gritty matters of running the country tend to be less complimentary.
Just half the public (50%) believes Bush has a clear plan for solving the country's problems; 47% do not. Views on the latter are highly partisan, with 82% of Republicans, but only 22% of Democrats, giving Bush credit for having a clear plan. Furthermore, the public has historically been more critical of presidents on this dimension. In January 1998, 59% of Americans approved of the job Bill Clinton was doing as president and 69% approved of his handling of the economy, but only 49% felt he had a clear plan for solving the country's problems.
Along the same lines, the public is closely divided on whether or not Bush is in sync with them on the issues. Only 53% of Americans say they agree with Bush "on the issues that matter most" to them, while 46% say they disagree with Bush on these issues. Again, 89% of Republicans agree with Bush, compared with only 22% of Democrats.
Bush Approval Slips Among Seniors
Although Bush's overall approval rating has changed little over the past month, there have been some intriguing changes by subgroup that bear watching over the coming weeks to see if they hold. (Small sample sizes for these groups means that the data could be a result of sampling error, rather than real changes in the population.)
- Bush's approval rating has gone up among high-income households, but down among most lower income groups. Among those earning $75,000 or more per year, his approval rating rose from 58% in mid-June to 69% in late June. Among all those earning less than $75,000, his approval rating fell slightly from 64% to 60%.
- Support for Bush among younger age groups either held firm or rose over the past two weeks, while his support among older Americans fell. Thus, while earlier in June (and for most of 2003), support for Bush was about even across all age groups, today he is performing substantially better among those under 50 than among those 50 and older.
|
Bush Approval by Age Recent Trend |
||||
|
18-29 |
30-49 |
50-64 |
65+ |
|
|
Change |
-1% |
+5 |
-8 |
-12 |
|
2003 Jun 27-29 |
63% |
66 |
58 |
52 |
|
2003 Jun 12-15 |
64% |
61 |
66 |
64 |
The latest drop in support for Bush among older Americans is potentially significant because of Bush's recent effort to push a Medicare reform bill through Congress that would add a prescription drug benefit to the plan. While the effort is intended to appeal to seniors, critics of the plan say it does not go far enough and suggest it could backfire on Bush, creating more disappointment than credit for him among this important electoral group.
Survey Methods
These results are based on telephone interviews with a randomly selected national sample of 1,003 adults, 18 years and older, conducted June 27-29, 2003. For results based on this sample, one can say with 95 percent confidence that the maximum error attributable to sampling and other random effects is plus or minus 3 percentage points. In addition to sampling error, question wording and practical difficulties in conducting surveys can introduce error or bias into the findings of public opinion polls.
Thinking about the following characteristics and qualities, please say whether you think it applies or doesn't apply to George W. Bush. How about – [ROTATED]?
A. Cares about the needs of people like you
|
Applies |
Doesn't apply |
No opinion |
||
|
% |
% |
% |
||
|
2003 Jun 27-29 |
57 |
42 |
1 |
|
|
2003 Apr 5-6 |
65 |
34 |
1 |
|
|
2003 Jan 10-12 ^ |
56 |
41 |
3 |
|
|
2002 Nov 8-10 |
60 |
38 |
2 |
|
|
2002 Jul 26-28 |
60 |
36 |
4 |
|
|
2002 Apr 29-May 1 |
66 |
31 |
3 |
|
|
2001 Oct 5-6 |
69 |
29 |
2 |
|
|
2001 Jul 10-11 |
57 |
40 |
3 |
|
|
2001 Apr 20-22 |
59 |
39 |
2 |
|
|
2001 Feb 9-11 |
56 |
39 |
5 |
|
|
2000 Mar 10-12 |
51 |
42 |
7 |
|
|
2000 Jan 17-19 |
56 |
33 |
11 |
|
|
1999 Sep 10-14 |
59 |
32 |
9 |
|
|
1999 Mar 12-14 |
59 |
32 |
9 |
|
|
^ |
Asked of a half sample. |
|||
B. Is honest and trustworthy
|
Applies |
Doesn't apply |
No opinion |
||
|
% |
% |
% |
||
|
2003 Jun 27-29 |
65 |
33 |
2 |
|
|
2003 Apr 5-6 |
73 |
25 |
2 |
|
|
2003 Jan 10-12 ^ |
70 |
27 |
3 |
|
|
2002 Jul 26-28 |
69 |
26 |
5 |
|
|
2002 Apr 29-May 1 |
77 |
20 |
3 |
|
|
2001 Jul 10-11 |
66 |
31 |
3 |
|
|
2001 Apr 20-22 |
67 |
29 |
4 |
|
|
2001 Feb 9-11 |
64 |
29 |
7 |
|
|
2000 Mar 10-12 |
64 |
28 |
8 |
|
|
1999 Sep 10-12 |
62 |
29 |
9 |
|
|
^ |
Asked of a half sample. |
|||
C. Is a person you admire
|
Applies |
Doesn't apply |
No opinion |
|
|
2003 Jun 27-29 |
54% |
45 |
1 |
|
2002 Apr 29-May 1 |
64% |
33 |
3 |
|
2001 Feb 9-11 |
49% |
47 |
4 |
|
2000 Feb 20-21 |
45% |
49 |
6 |
D. Has a clear plan for solving this country's problems
|
Applies |
Doesn't apply |
No opinion |
|
|
2003 Jun 27-29 |
50% |
47 |
3 |
|
2002 Nov 8-10 |
53% |
42 |
5 |
E. Is a strong and decisive leader
|
Applies |
Doesn't apply |
No opinion |
||
|
% |
% |
% |
||
|
2003 Jun 27-29 |
75 |
24 |
1 |
|
|
2003 Apr 5-6 |
80 |
19 |
1 |
|
|
2003 Jan 10-12 ^ |
76 |
23 |
1 |
|
|
2002 Jul 26-28 |
70 |
27 |
3 |
|
|
2002 Apr 29-May 1 |
77 |
21 |
2 |
|
|
2001 Oct 5-6 |
75 |
23 |
2 |
|
|
2001 Aug 10-12 |
55 |
43 |
2 |
|
|
2001 Jul 10-11 |
57 |
40 |
3 |
|
|
2001 Apr 20-22 |
60 |
37 |
3 |
|
|
2001 Feb 9-11 |
61 |
34 |
5 |
|
|
2000 Mar 10-12 |
63 |
30 |
7 |
|
|
2000 Feb 25-27 |
61 |
32 |
7 |
|
|
2000 Feb 20-21 |
58 |
33 |
9 |
|
|
2000 Feb 4-6 |
62 |
30 |
8 |
|
|
2000 Jan 17-19 |
66 |
24 |
10 |
|
|
1999 Mar 4 |
60 |
14 |
26 |
|
|
^ |
Asked of a half sample. |
|||
SUMMARY TABLE: BUSH QUALITIES AND CHARACTERISTICS
|
2003 Jun 27-29 |
|
Doesn't apply |
|
% |
% |
|
|
Is a strong and decisive leader |
75 |
24 |
|
Is honest and trustworthy |
65 |
33 |
|
Cares about the needs of people like you |
57 |
42 |
|
Is a person you admire |
54 |
45 |
|
Has a clear plan for solving the country's problems |
50 |
47 |
Please tell me whether you agree or disagree that George W. Bush has the personality and leadership qualities a president should have.
|
Agree |
Disagree |
No opinion |
|
|
% |
% |
% |
|
|
2003 Jun 27-29 |
64 |
35 |
1 |
|
2002 Jan 25-27 |
79 |
19 |
2 |
|
2001 Aug 10-12 |
57 |
41 |
2 |
|
2001 Jun 8-10 |
54 |
42 |
4 |
|
2000 Aug 18-19 |
64 |
32 |
4 |
|
2000 Aug 11-12 |
65 |
28 |
7 |
|
2000 Aug 4-5 |
70 |
26 |
4 |
|
2000 Jul 25-26 |
62 |
32 |
6 |
|
2000 Apr 7-9 |
61 |
30 |
9 |
|
2000 Jan 17-19 |
65 |
28 |
7 |
|
2000 WORDING: Please tell me whether you agree or disagree that [ROTATE: Al Gore/George Bush] has the personality and leadership qualities a president should have. How about…? |
|||
Please tell me whether you agree or disagree with George W. Bush on the issues that matter most to you.
|
Agree |
Disagree |
No opinion |
|
|
2003 Jun 27-29 |
53% |
46 |
1 |
|
2002 Jan 25-27 |
71% |
25 |
4 |
|
2001 Aug 10-12 |
52% |
42 |
6 |
|
2001 Jun 8-10 |
49% |
47 |
4 |
Would you say you trust what George W. Bush says – [ROTATED: More, about the same, or less] – than you trusted what previous presidents said while in office?
|
More |
About the same |
Less |
No opinion |
|
|
2003 Jun 27-29 |
41% |
25 |
32 |
2 |
* -- Less than 0.5%.
