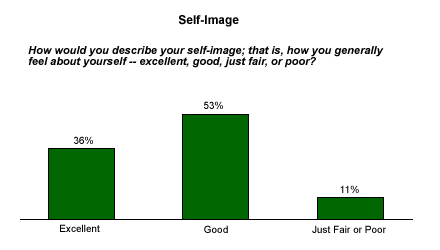
Most Americans appear to have a reasonably good self-image, according to a recent Gallup Poll*. The poll asked Americans to describe their self-image, or how "you generally feel about yourself." Thirty-six percent of Americans said they felt "excellent," while an additional 53% said they felt "good." Only about 1 in 10 Americans rated the image of themselves as "just fair" or "poor."

An analysis of the results shows that a person's health, diet, age, and income are strongly related to a person's self-image. Younger Americans, particularly those aged 18 to 29, have a higher self-image than older Americans do.
Although Gallup's self-image question made no mention of health or physical well-being, Americans' responses to the question are highly related to their physical health. Respondents who report being in good health and eating a healthy diet are much more likely than those who don't to express a positive self-image. Upper-income Americans (who make more than $50,000 annually) are also more likely to have a positive self-image than those with lower incomes.
Self-Image High Among All Americans
The table below represents the self-image of a variety of subgroups of the American population, ranked by the percentage who describe their self-image as excellent.
|
Personal Self-Image Among Demographic Groups Groups With Highest View of Self-Image
|
||||
|
Sorted by percent who describe self image as excellent |
Excellent |
Good |
Just fair |
Poor |
|
% |
% |
% |
% |
|
|
Adults who describe current health as excellent |
62 |
35 |
2 |
1 |
|
Adults who describe diet as very healthy |
53 |
42 |
3 |
1 |
|
18- to 29-year-olds |
49 |
45 |
5 |
1 |
|
Earn $50,000-$74,999 per year |
46 |
48 |
5 |
1 |
|
Earn $75,000 per year or more |
44 |
52 |
4 |
* |
|
Nonwhites |
43 |
41 |
13 |
3 |
|
Men, aged 18 to 49 |
42 |
46 |
10 |
2 |
|
Adults who say their weight is about right |
42 |
51 |
6 |
1 |
|
Southerners |
41 |
45 |
13 |
1 |
|
Adults who attend church weekly |
41 |
50 |
7 |
1 |
|
Adults with children age 18 or under |
40 |
52 |
8 |
* |
|
Adults employed full or part time |
40 |
51 |
8 |
1 |
|
Westerners |
39 |
53 |
6 |
2 |
|
Men |
38 |
49 |
11 |
2 |
|
Married adults |
38 |
52 |
9 |
1 |
|
Adults who lost weight in the past five years |
38 |
51 |
10 |
* |
|
Adults who do not drink too much alcohol |
38 |
54 |
7 |
1 |
|
Women, aged 18 to 49 |
37 |
56 |
6 |
1 |
|
50- to 64-year-olds |
37 |
53 |
9 |
1 |
|
Total Sample of National Adults |
36 |
53 |
10 |
1 |
|
Non-smokers |
36 |
54 |
9 |
1 |
|
Earn $30,000-$49,999 per year |
36 |
56 |
8 |
* |
|
Alcohol drinkers |
36 |
56 |
7 |
1 |
|
Adults whose weight unchanged in past 5 years |
36 |
53 |
9 |
1 |
|
Non-alcohol drinkers |
35 |
49 |
14 |
2 |
|
Adults who attend church nearly weekly |
35 |
54 |
10 |
1 |
|
30- to 49-year-olds |
35 |
54 |
9 |
2 |
|
Smokers |
34 |
52 |
12 |
2 |
|
Non-married adults |
34 |
55 |
9 |
2 |
|
Non-Hispanic Whites |
34 |
57 |
8 |
1 |
|
Adults with no children age 18 or under |
34 |
54 |
10 |
2 |
|
Adults who rarely or never attend church |
34 |
54 |
10 |
2 |
|
Adults who gained weight in the past five years |
34 |
54 |
9 |
2 |
|
Women |
33 |
58 |
8 |
1 |
|
Adults who describe diet as somewhat healthy |
33 |
56 |
10 |
1 |
|
Men, aged 50 and older |
32 |
52 |
13 |
2 |
|
Easterners |
32 |
57 |
9 |
2 |
|
Midwesterners |
30 |
62 |
8 |
* |
|
Adults who sometimes drink too much alcohol |
30 |
63 |
6 |
1 |
|
Women, aged 50 and older |
29 |
59 |
11 |
1 |
|
Adults who are not employed |
29 |
56 |
12 |
2 |
|
Adults who say they are overweight |
28 |
57 |
13 |
2 |
|
Earn $20,000-$29,999 per year |
26 |
60 |
12 |
2 |
|
Earn less than $20,000 per year |
25 |
50 |
21 |
3 |
|
Adults who describe current health as good |
25 |
66 |
8 |
1 |
|
Adults who describe diet as not healthy |
22 |
58 |
16 |
4 |
|
65 years and older |
22 |
61 |
15 |
1 |
|
Adults who describe current health as fair/poor |
21 |
50 |
24 |
4 |
Respondents who have the highest self-image also describe their personal health and diet positively. Sixty-two percent of those who describe their personal health as excellent have a high self-image. Likewise, 53% of those who describe their diets as very health have a positive perception of self.
- Americans earning above $50,000 per year have a higher self-image than lower-
income respondents do, with more than 4 in 10 adults in the higher income brackets saying their self-image is excellent and only about one in four lower-income adults offering this response, particularly among those earning less than $30,000 per year.
- Twenty-one percent of adults who describe their physical health as just fair or poor, 22% of adults who describe their diet as not healthy, and 22% of adults aged 65 and older say their self-image is excellent. These are among the lowest percentages found among demographic groups on this measure. (It is important to note, however, that at least half of all adults in these groups rate their self-image as good, and between 16% and 29% rate their self-image as just fair or poor.)
- Similarly, Americans who are overweight also have below-average self-images (28% saying they have an excellent self-image). Respondents who say their weight is about right are much more likely to have a positive self-image, with upwards of 4 in 10 describing their image as excellent.
- The self-image of smokers is just about even with non-smokers. Thirty-four percent of smokers say they have an excellent self-image, compared with 36% of non-smokers offering the same response.
- Nearly half of the 18- to 29-year-olds (49%) interviewed in the poll have an excellent self-image, compared with 35% of 30- to 49-year-olds and 37% of 50- to 64-year-olds. These findings should be viewed as encouraging, given the public health concerns that exist about the pressure on young people to conform to unreasonably thin or athletic body types presented in the media.
- Other demographic groups with elevated levels of self-esteem include: nonwhites (at 43%); younger men, and Americans who say their weight is about right (each at 42%); and Southerners and weekly churchgoers (each at 41%).
- Demographic subgroups who have lower levels of self-esteem include: unemployed adults (29%), and women who are aged 50 and older (29%).
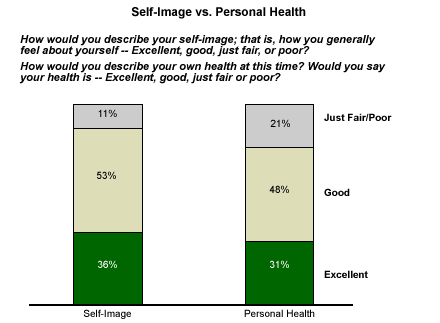
- Interestingly, Americans are slightly more inclined to describe their self-image as excellent than they are to rate their personal health this highly, although a strong majority rates both their self-image and personal health positively. Only about 3 in 10 Americans, 31%, rate their personal health as excellent today. Less than half, 48%, rate their health as good, and roughly one in five Americans rate it as just fair or poor.

*The results are based on telephone interviews with a randomly selected national sample of 1,006 adults, aged 18 and older, compiled from a poll conducted July 7-9, 2003. For results based on this sample, one can say with 95% confidence that the maximum error attributable to sampling and other random effects is ±3 percentage points. In addition to sampling error, question wording and practical difficulties in conducting surveys can introduce error or bias into the findings of public opinion polls.