GALLUP NEWS SERVICE
PRINCETON, NJ -- In the aftermath of the Sept. 11 terrorist attacks, Americans "rallied" around their government and leaders, expressing unusually high levels of trust and confidence in their ability to deal with the country's problems. But the latest annual Gallup survey of public attitudes about governance issues finds that the gradual decline in trust that began in 2002 has now fallen below the levels measured just before 9/11. Still, solid majorities of the public express high trust and confidence in the federal government to deal with international and domestic problems. Also, solid majorities give high marks to the three branches of the federal government, and to the men and women elected to public office.
The annual governance poll, conducted Sept. 8-10, finds that 63% of Americans have either a "great deal" (16%) or "fair amount" (47%) of trust and confidence in the "federal government in Washington" to handle international problems. Similarly, 58% of Americans have either a great deal (9%) or fair amount (49%) of trust in the government to handle domestic problems. These figures represent declines of about 20 percentage points from the levels of trust measured a month after 9/11.
Trust: International
| How much trust and confidence do you have in
our federal government in Washington when it comes to handling
international problems? International Problems |
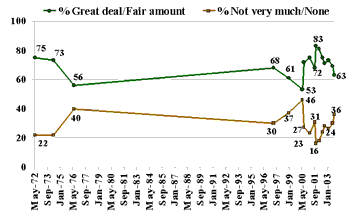 |
Gallup measured trust in the period of 1972-1976, but then did not resume asking the questions until 1997. The early measures showed a decline in the area of international problems in the aftermath of Watergate (President Nixon resigned in August 1974). In 1997, when Gallup again asked the question, two-thirds of Americans expressed a high level of trust, but when the United States got involved in the war in Kosovo, trust in this area declined. With the successful conclusion of that effort, trust rebounded. It jumped after the terrorist attacks in the United States, but has since declined to its pre-9/11 level.
Trust: Domestic
| How much trust and confidence do you have in
our federal government in Washington when it comes to handling
domestic problems? Domestic Problems |
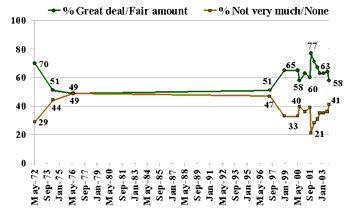 |
In the wake of Watergate, the public was about evenly divided between high and low confidence in government's ability to deal with domestic problems -- 49% had a great deal or fair amount of trust; another 49% said they had "not very much" or no trust at all.
In 1997, the divide was about the same: 51% high trust, 47% low trust. But subsequent measures showed a resurgence of trust, and then a spike after 9/11. The current reading is the same as that measured in the summer of 2000.
Trust: Three Branches of Government
Unlike the previous two areas, measures of trust in the three branches of government were not updated shortly after 9/11, but were asked again the following year.
| How much trust and confidence do you have at this time in the executive branch headed by the president? |
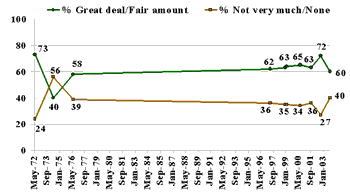 |
A year after the terrorist attacks, trust in the executive branch was nine points higher than the previous year just prior to 9/11. Now trust has fallen back to its normal level.
| How much trust and confidence do you have at this time in the legislative branch, consisting of the U.S. Senate and House of Representatives? |
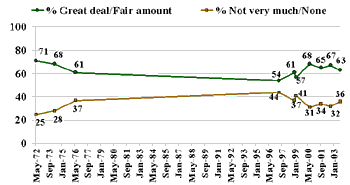 |
The legislative branch showed no elevated rating in 2002, a year after 9/11, and its current rating is about the same as it was for the previous three years.
| How much trust and confidence do you have at this time in the judicial branch headed by the U.S. Supreme Court? |
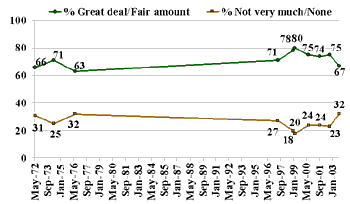 |
The judicial branch, "headed by the U.S. Supreme Court," has not fallen below the 60% level in any poll conducted by Gallup. The current 67% trust level is lower than the peak of 80% in 1999, right before the impeachment trial of President Clinton.
Trust: State and Local Government and Elected Leaders
This year the trust in state government -- at 53% -- is the lowest it has ever been measured in Gallup Polls and lower than any of the areas dealing with the federal government.
How much trust and confidence do you have in the government of the state where you live when it comes to handling state problems -- a great deal, a fair amount, not very much, or none at all?
|
Great |
Fair |
Not very |
None |
No |
|
|
% |
% |
% |
% |
% |
|
|
2003 Sep 8-10 |
12 |
41 |
34 |
12 |
1 |
|
2001 Sep 7-10 |
17 |
48 |
27 |
7 |
1 |
|
1998 Dec 28-29 |
29 |
51 |
15 |
4 |
1 |
|
1997 May 30-Jun 1 |
18 |
50 |
25 |
6 |
1 |
|
1976 Jun |
13 |
59 |
19 |
7 |
2 |
|
1974 Apr |
16 |
59 |
17 |
3 |
4 |
|
1972 May |
15 |
48 |
27 |
6 |
3 |
The highest rating for their own state government came in December 1998, just after President Clinton had been impeached by the House of Representatives and was awaiting trial by the U.S. Senate.
Similarly, the highest rating for local government came in the midst of the impeachment process. Besides that time, ratings all tend to be high.
And how much trust and confidence do you have in the local governments in the area where you live when it comes to handling local problems -- a great deal, a fair amount, not very much, or none at all?
|
Great |
Fair |
Not very |
None |
No |
|
|
% |
% |
% |
% |
% |
|
|
2003 Sep 8-10 |
18 |
50 |
23 |
8 |
1 |
|
2001 Sep 7-10 |
19 |
50 |
20 |
10 |
1 |
|
1998 Dec 28-29 |
23 |
54 |
16 |
5 |
2 |
|
1997 May 30-Jun 1 |
21 |
48 |
21 |
7 |
2 |
|
1976 Jun |
13 |
52 |
23 |
9 |
3 |
|
1974 Apr |
16 |
55 |
16 |
8 |
5 |
|
1972 May |
12 |
51 |
26 |
7 |
4 |
Unlike state government, local government receives about the same rating it did two years ago.
Americans are fairly consistent in the level of trust they express for their elected leaders.
How much trust and confidence do you have in general in men and women in political life in this country who either hold or are running for public office -- a great deal, a fair amount, not very much, or none at all?
|
Great |
Fair |
Not very |
None |
No |
||
|
% |
% |
% |
% |
% |
||
|
2003 Sep 8-10 |
5 |
54 |
36 |
4 |
1 |
|
|
2002 Sep 5-8 |
6 |
54 |
33 |
6 |
1 |
|
|
2001 Sep 7-10 ^ |
4 |
51 |
39 |
6 |
* |
|
|
2000 Jul 6-9 |
7 |
57 |
31 |
3 |
2 |
|
|
1998 Dec 28-29 |
7 |
56 |
31 |
4 |
2 |
|
|
1997 May 30-Jun 1 |
5 |
52 |
37 |
5 |
1 |
|
|
1976 Jun |
6 |
58 |
28 |
4 |
4 |
|
|
1974 Apr |
7 |
61 |
24 |
4 |
4 |
|
|
1972 May |
7 |
58 |
27 |
5 |
2 |
|
|
* Less than 0.5% |
||||||
|
^ |
Asked of a half sample. |
|||||
The least trust was expressed in the days before the terrorist attacks, when just 55% of Americans expressed a high level of trust and 45% a low level.
Conclusion
Clear majorities of Americans express high levels of trust in all three branches of government, in their elected leaders, and in the ability of the federal government to handle both international and domestic problems. The truly disgruntled constitute only a small proportion of all Americans, and can be represented by those who say they have no trust at all in each of the institutions.
On average, about 1 in 10 Americans fall into this category on any given item -- 9% for each area of domestic and international problems, 14% for the executive branch, 5% each for the legislative branch and the judicial branch, 12% for state government, 8% for local government, and 4% for the men and women who hold political office.
Survey Methods
Results are based on telephone interviews with 1,025 national adults, aged 18+, conducted Sept. 8-10, 2003. For results based on the total sample of national adults, one can say with 95% confidence that the margin of sampling error is ±3 percentage points.
For results based on the 517 national adults in the Form A half-sample and 508 national adults in the Form B half-sample, the maximum margins of sampling error are ±5 percentage points.
In addition to sampling error, question wording and practical difficulties in conducting surveys can introduce error or bias into the findings of public opinion polls.
12. Now I'd like to ask you several questions about our governmental system. First, how much trust and confidence do you have in our federal government in Washington when it comes to handling [Read A-B] -- a great deal, a fair amount, not very much, or none at all?
A. International Problems
|
Great |
Fair |
Not very |
None |
No |
|
|
% |
% |
% |
% |
% |
|
|
2003 Sep 8-10 |
16 |
47 |
27 |
9 |
1 |
|
2003 Jul 18-20 |
17 |
52 |
25 |
5 |
1 |
|
2003 Feb 3-6 |
17 |
56 |
20 |
6 |
1 |
|
2002 Sep 5-8 |
18 |
53 |
22 |
6 |
1 |
|
2002 Jun 17-19 |
21 |
54 |
18 |
6 |
1 |
|
2002 Feb 4-6 |
21 |
60 |
14 |
4 |
1 |
|
2001 Oct 11-14 |
36 |
47 |
13 |
3 |
1 |
|
2001 Sep 7-10 |
14 |
54 |
25 |
6 |
1 |
|
2001 Feb 1-4 |
12 |
63 |
19 |
4 |
2 |
|
2000 Jul 6-9 |
17 |
55 |
21 |
6 |
1 |
|
2000 May 18-21 |
8 |
45 |
34 |
12 |
1 |
|
1998 Dec 28-29 |
9 |
52 |
30 |
7 |
2 |
|
1997 May 30-Jun 1 |
10 |
58 |
23 |
7 |
2 |
|
1976 Jun |
8 |
48 |
33 |
7 |
4 |
|
1974 Apr |
24 |
49 |
18 |
4 |
3 |
|
1972 May |
20 |
55 |
20 |
2 |
4 |
B. Domestic Problems
|
Great |
Fair |
Not very |
None |
No |
|
|
% |
% |
% |
% |
% |
|
|
2003 Sep 8-10 |
9 |
49 |
32 |
9 |
1 |
|
2003 Jul 18-20 |
14 |
50 |
29 |
7 |
* |
|
2003 Feb 3-6 |
11 |
52 |
28 |
7 |
2 |
|
2002 Sep 5-8 |
11 |
52 |
28 |
7 |
2 |
|
2002 Jun 17-19 |
13 |
54 |
23 |
8 |
2 |
|
2002 Feb 4-6 |
12 |
59 |
23 |
5 |
1 |
|
2001 Oct 11-14 |
24 |
53 |
17 |
4 |
2 |
|
2001 Sep 7-10 |
6 |
54 |
31 |
8 |
1 |
|
2001 Feb 1-4 |
7 |
56 |
28 |
8 |
1 |
|
2000 Jul 6-9 |
10 |
48 |
30 |
10 |
2 |
|
2000 May 18-21 |
11 |
54 |
26 |
7 |
2 |
|
1998 Dec 28-29 |
11 |
54 |
26 |
7 |
2 |
|
1997 May 30-Jun 1 |
6 |
45 |
36 |
11 |
2 |
|
1976 Jun |
5 |
44 |
42 |
7 |
3 |
|
1974 Apr |
9 |
42 |
36 |
8 |
4 |
|
1972 May |
11 |
59 |
26 |
3 |
2 |
13. As you know, our federal government is made up of three branches: an Executive branch, headed by the President: a Judicial branch, headed by the U.S. Supreme Court: and a Legislative branch, made up of the U.S. Senate and House of Representatives. First, let me ask you how much trust and confidence you have at this time in the Executive branch headed by the President, the Judicial branchheaded by the US Supreme Court, and the Legislative branch, consisting of the US Senate and House of Representatives-- a great deal, a fair amount, not very much, or none at all?
A. The Executive branch headed by the President
|
Great |
Fair |
Not very |
None |
No |
|
|
% |
% |
% |
% |
% |
|
|
2003 Sep 8-10 |
25 |
35 |
26 |
14 |
* |
|
2002 Sep 5-8 |
28 |
44 |
20 |
7 |
1 |
|
2001 Sep 7-10 |
21 |
42 |
28 |
8 |
1 |
|
2000 Jul 6-9 |
18 |
47 |
23 |
11 |
1 |
|
1999 Feb 4-8 |
21 |
43 |
24 |
11 |
1 |
|
1998 Dec 28-29 |
24 |
39 |
23 |
12 |
2 |
|
1997 May 30-Jun 1 |
13 |
49 |
27 |
9 |
2 |
|
1976 Jun |
13 |
45 |
30 |
9 |
4 |
|
1974 Apr |
12 |
28 |
36 |
20 |
3 |
|
1972 May |
24 |
49 |
20 |
4 |
2 |
B. The Judicial branch, headed by the U.S. Supreme Court
|
Great |
Fair |
Not very |
None |
No |
|
|
% |
% |
% |
% |
% |
|
|
2003 Sep 8-10 |
13 |
54 |
27 |
5 |
1 |
|
2002 Sep 5-8 |
17 |
58 |
18 |
5 |
2 |
|
2001 Sep 7-10 |
17 |
57 |
20 |
4 |
2 |
|
2000 Jul 6-9 |
23 |
52 |
18 |
6 |
1 |
|
1999 Feb 4-8 |
29 |
51 |
13 |
5 |
2 |
|
1998 Dec 28-29 |
27 |
51 |
16 |
4 |
2 |
|
1997 May 30-Jun 1 |
19 |
52 |
22 |
5 |
2 |
|
1976 Jun |
16 |
47 |
26 |
6 |
4 |
|
1974 Apr |
17 |
54 |
20 |
5 |
5 |
|
1972 May |
17 |
49 |
24 |
7 |
4 |
C. The Legislative branch, consisting of the U.S. Senate and House of Representatives
|
Great |
Fair |
Not very |
None |
No |
|
|
% |
% |
% |
% |
% |
|
|
2003 Sep 8-10 |
8 |
55 |
31 |
5 |
1 |
|
2002 Sep 5-8 |
9 |
58 |
26 |
6 |
1 |
|
2001 Sep 7-10 |
7 |
58 |
28 |
6 |
1 |
|
2000 Jul 6-9 |
11 |
57 |
24 |
7 |
1 |
|
1999 Feb 4-8 |
8 |
49 |
34 |
7 |
2 |
|
1998 Dec 28-29 |
13 |
48 |
30 |
7 |
2 |
|
1997 May 30-Jun 1 |
6 |
48 |
36 |
8 |
2 |
|
1976 Jun |
9 |
52 |
31 |
6 |
4 |
|
1974 Apr |
13 |
55 |
24 |
4 |
4 |
|
1972 May |
13 |
58 |
22 |
3 |
3 |
