GALLUP NEWS SERVICE
Have and Have Nots
This study is based on a survey of 5,001 American adults, conducted between April 23 and May 31, 1998. The survey was designed to provide a baseline summary of Americans' assessments of their own socioeconomic position, well-being, and satisfaction with various aspects of their lives, and to elicit Americans' perceptions of economic inequality, fairness, and opportunity in the United States today.
The results suggest that about one-quarter of Americans, in one way or another, consider themselves to be have-nots. This one-in-four ratio is seen across a variety of measures. These include designating oneself as a have-not rather than a have, worrying about household finances either "most" or "all" of the time, not having had enough money to pay for basic necessities at some time during the past year, perceiving one's financial situation as being worse than that of one's parents, and labeling one's financial situation as "poor" or "lower income."
Broadly speaking, where historical data are available, answers to self-reported questions such as these do not provide much support for the proposition that Americans perceive a widening gap between haves and have-nots in this country.
The portrait of Americans who are most likely to define themselves as have-nots is straightforward: it includes those with low incomes, those who have lower levels of education, single Americans, those who rent rather than own a house, African American and Hispanic minorities, and those with little personal wealth. Still, large numbers of Americans whose income and wealth places them at the lower end of the economic spectrum in the U.S. resist the have-not label.
At the upper end of the spectrum, there has been a slight increase since 1990 in the number of Americans who consider themselves to be "rich" or "upper income."
From a slightly different perspective, the results of the study indicate that well over half, and in many instances three-quarters or more, of Americans are satisfied with a number of aspects of American and family life today. The trends on these measures generally show increases in satisfaction since the 1980s.
Only in terms of the amount of leisure time they have, and in terms of their personal net worth or financial savings, do more than one in three Americans claim to be dissatisfied.
Americans who are "have-nots" tend to be less satisfied with most aspects of their lives, as would be expected, but at least half of these remain satisfied on each of the measures, with the exception of income and savings.
Americans' general assessments of their lives, and of their expectations for their lives five years in the future show that, consistent with previous findings, Americans are quite positive in their evaluation of their present situation, and even more optimistic about their future prospects. In fact, Americans are now both more positive and more optimistic than they have been in any of Gallup's seven prior measurements, beginning in 1964.
There are, as is often the case in survey research, some differences between Americans' perceptions of their own current situation and their perceptions of the situation of the country as a whole. For example, there has been an increase in the percentage of Americans that perceives American society to be divided into haves and have-nots, but the percentage that agrees that this division exists is still only about four out of ten.
Historical trend data suggest that majorities of Americans consistently perceive the percentage of rich people and the percentage of poor people to be increasing. That tendency persists in this study, although (1) more Americans perceive that the rich population is growing than perceive that the poor population is growing; and (2) more Americans today believe that the poor population is decreasing, and that the rich population is increasing, than did so eight years ago.
The study finds mixed opinions about the structure of the American system of economic equality, opportunity, and social mobility today. Most Americans believe that there is plenty of opportunity in the United States for those who work hard to reach their goals. The system is viewed by two-thirds of those interviewed as basically fair with providing equal opportunities for all Americans to succeed. Eight out of ten Americans say that there is plenty of opportunity for those who work hard to go as far as they want; and when asked whether there is more, less, or about the same opportunity as there used to be, Americans are twice as likely to say that there is more opportunity than that there is less.
As might be expected, haves (based either on subjective self-reported, or more objective, measures) are more likely to view the system as fair, and opportunity as plentiful, than are have-nots. However, those at the upper end of the economic spectrum are not overwhelmingly positive in their evaluations of the system, and those at the lower end are less critical than might be expected.
Additionally, when asked to evaluate the importance of a variety of factors in determining a person's success in life, factors referring to hard work and education are rated as most important, while factors that are less merit-based, and less compatible with the ideal of equal opportunity, including race, gender, inherited money, and luck, are considered much less important. Even the answers of those who describe themselves as "have-nots" conform to this pattern of response.
At the same time, the study suggests that Americans generally appear to desire a reduction in the degree of economic inequality in this country. This conclusion is based on a variety of observations, including: responses to a question about whether money and wealth in this country should be more evenly distributed, agreement with the statement that the rich get richer and the poor get poorer (which Americans tend to see as a bad thing), agreement among those who see the country as divided into haves and have-nots that this is a bad thing, agreement with the proposition that the fact that some people in the U.S. are rich and others are poor represents a problem that needs to be fixed, and substantial and apparently increasing (if not majority) support for the idea of government redistribution of wealth by heavy taxes on the rich. There is some evidence to suggest that these opinions are driven by concern about those at the lower end of the economic spectrum-Americans appear more troubled by the existence of poverty than disturbed by the existence of disproportionate wealth.
There is clear evidence that the public expects the government to be involved in helping to improve the situation of the have-nots in society, mainly through education and job training, rather than through income transfer programs.
Finally, only about one in seven Americans believes he or she is saving enough for retirement, while one in five says he or she is not saving at all. With an extraordinarily large number of adults approaching retirement age in the U.S., this issue looms as one that may shape future perceptions of economic inequality and fairness in this country.
1. SUBJECTIVE REPORTS OF PERSONAL STATUS
The 5,001 interviews that form the basis of this project were conducted among the nation's adults in April and May of this year, against the backdrop of one of the longest sustained periods of economic expansion in U.S. history, and in many ways the results reflect this context. Nevertheless, across a variety of questions focusing on Americans' perceptions of their own lives, survey evidence suggests that about one quarter of the nation's adults consider themselves to be have-nots.
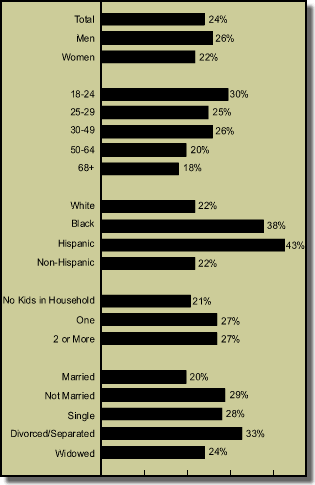
The most basic of these measures is straightforward: the response to a direct question asking Americans into which category they would place themselves: the haves or the have-nots. Currently, 24% of Americans describe themselves as have-nots. This represents an apparent increase over the results of a Gallup survey conducted in 1988, when 17% characterized themselves in this way.
At the same time, the percentage of Americans who consider themselves to be haves has also increased, from 59% to 67%. The explanation for these increases in both have and have-not categories is that the percentage of respondents answering "neither," or "don't know" was more than twice as large in 1988 as it is now.
When these miscellaneous "volunteered" responses are factored out, the result is only a slight, four-percentage-point increase in the percentage claiming to be have-nots.
paragraph
Do Americans Classify Themselves as "Haves" or "Have-Nots?"--Trend
Q12. If you had to choose, which of these groups are you in--the haves, or the have-nots?

Personal Financial Well-Being
Consistent with the finding that 24% of Americans describe themselves as have-nots, the survey results show that a similar proportion of American adults, 21%, worries about its ability to meet its own family's expenses either all or most of the time. This level of worry represents a modest decline from that of 1989-when 26% gave a "worried" response to this question-and is a more dramatic reduction from the high water mark of Gallup's historical trend on financial worry recorded in 1984, when 35% claimed to worry all or most of the time about their family's expenses.
Frequency of Concern About Meeting Family Expenses--Trend
Q13. How often do you worry that your total family income will not be enough to meet your family's expenses and bills--all of the time, most of the time, some of the time, or almost never?

Self-Reported Financial Situation
Other ways of assessing the percentage of Americans who are have-nots were included in this study. One such measure is a self-classification of one's economic status. Twenty-seven percent of Americans consider themselves to be either "lower income" (21%) or "poor" (6%). The size of the self-reported lower income/poor group shows a slight decrease over the last eight years, from 33% in 1990 to 27% today.
The percentage of Americans who place themselves at the upper end of the economic spectrum, describing themselves as "rich" or "upper income" has increased from 7% in 1990 to 12% today. As noted, this shift is matched by a reduction in the percentage of Americans considering themselves to be either "lower income" or "poor." The result is that-in the recent past, at least-about 80% of Americans continue to place themselves in the middle and lower income categories. Thus, although some economists and social observers have expressed concern about a growing divide between high- and low-income groups, this self-classification measure provides no evidence of increasing economic polarization.
Self-Described Income Class--Trend
Q9a. Thinking just about your own financial situation, do you consider yourself to be rich, upper income, middle income, lower income, or poor?

Economic Deprivation
Three questions included in this study were designed to measure the percentage of adults who, at some time in the year preceding the interview, did not have enough money to pay for food, clothing, or health care.
The percentage of Americans reporting such deprivation ranges from 11% for food to 18% for clothing to 22% for health care. Twenty-eight percent of Americans, in total, claimed to have experienced at least one of these three kinds of deprivation during the last year.
Deprivation levels based on these self-reported measures are similar to those recorded in 1989. The percentages of Americans reporting that they did not have enough money for food, for clothing, and for health care, are all within one or two percentage points of those recorded in 1989.
Economic Deprivation--Trend
Q14,15,16. Have there been times during the last year when you did not have enough money to buy/pay for: Food your family needed? Clothing your family needed? Medical or health care?
(% Reporting not enough money to pay for food, clothing and health care)

Underscoring the stability of these self-reported deprivation measures is the consistency of a combined measure with its 1989 counterpart: when answers to these three questions are combined, the percentage of Americans experiencing at least one of these financial hardships is identical to its 1989 level of 28%. This lack of decline in deprivation may seem remarkable when considered against the backdrop of broad economic expansion, sustained record low levels of unemployment, and minimal inflation that prevailed between our 1989 and 1998 measurements. On the other hand, the absence of an increase in these deprivation measures may seem remarkable to those who have argued that the nation is becoming increasingly polarized, with those in the middle of the economic spectrum shifting to its extremes.
2. EXTENDING THE VIEW OF HAVES AND HAVE-NOTS: SELF-REPORTED SATISFACTION AND WELL-BEING
A more richly detailed picture of subjective inequality in this country can be obtained by examining Americans' self-reported satisfaction or dissatisfaction with 13 specific aspects of their lives.
A majority of Americans report satisfaction on each of these dimensions, although there is a wide range of variation, from 91% expressing satisfaction with family life to 56% claiming satisfaction with their financial net worth or savings. It is noteworthy that the level of satisfaction with net worth or savings falls significantly below all of the others, and that, of the three dimensions with the lowest satisfaction ratings, two relate to personal finances.
Satisfaction With Various Aspects of One's Personal Life
Q3. Please tell me whether you are generally satisfied or dissatisfied with each of the following?
(n=5,001)

Eight of these satisfaction dimensions have been tracked across time, and the current readings of most of these dimensions register toward the high end of their historical ranges. There are two exceptions, however, that register well below their historical high water marks: "Your job, or the work you do," which is 15 percentage points below its high point of 90% recorded in 1969, and "The amount of leisure time you have," which is currently 12 percentage points below its 1963 level of 76%.
Not surprisingly, satisfaction with the amount of leisure time one has skyrockets at retirement. Only 55% percent of employed adults express satisfaction with this dimension, compared with 95% of those who say they are retired. The leisure time question is also notable for being the only one in the set of questions that is negatively related to measures of socioeconomic status, both objective (income and education) and subjective (shape of personal finances). Americans with higher socioeconomic status and optimism about their personal finances are least satisfied with their leisure time availability.
General Measures of Well-Being
Another satisfaction dimension included in the study is a relatively general one-"The way things are going in your personal life." Fully 85% of Americans express satisfaction in response to this question. Historically, this measure has been quite stable: measured 43 times over the past two decades, it has never exceeded 87% nor dropped below the level of 73% reached in July of 1979.
Gallup asked two other questions intended to provide a broad assessment of Americans' personal well-being. The first is a simple question, asking respondents whether, generally speaking, they are "very," "fairly," or "not too" happy. Forty-five percent claim to be "very happy," while another 50% say they are "fairly happy." This combined total of over 90% claiming to be very or fairly happy is generally consistent with measurements recorded by Gallup stretching back to 1948.
The second measure of general well-being is based on a set of three questions developed by survey pioneer Hadley Cantril and asked by Gallup eight times since the early 1960s. The questions ask respondents to imagine a ladder, with steps numbered from zero (the lowest step) to ten (the highest). The bottom step is described as representing "the worst possible life for you," and the top step as representing "the best possible life for you." Respondents are first asked on which step "you feel you personally stand at the present time." Using the same scale, respondents are then asked on which step of the ladder they stood five years ago and, finally, on which step they expect to stand five years into the future.
When asked on which step they stand at the present time, 44% of Americans place themselves on one of the top three steps, 80% place themselves above the middle step, another 13% place themselves directly on the middle step, and only 7% place themselves on steps zero to four.
Americans are even more positive when they assess their future, with 72% saying that they will stand on steps eight, nine, or ten five years into the future. Americans are much less positive when they look back, with only 26% saying that they stood on one of the top three steps five years ago.
Current ratings both of one's present position and of one's anticipated position five years into the future are well above any ratings previously recorded by Gallup (at eight different points in time spanning 34 years). Ratings of one's position five years ago have been remarkably stable over the historical period beginning in 1964.
Americans Rate Their Lives--Past, Present, and Future on Cantril Self-Anchoring Striving Scale--Trend
Q5,6,7. Think about a picture of a ladder. Suppose we say that the top of the ladder represents the best possible life for you and the bottom represents the worst possible life for you. If the top step is "10" and bottom step is "0," on which step of the ladder do you feel you personally stand at the present time? Stood 5 years ago? Think you will stand in the future, say about 5 years from now? (n=5,001)
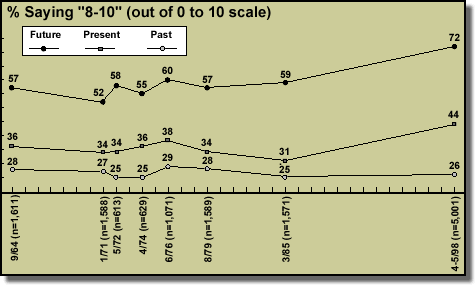
Results indicate that over the past several decades, Americans have been quite positive about their current situation, and exceedingly optimistic about their future, and that these patterns are more evident today than ever before.
Perceptions of Financial Mobility
Respondents were asked whether they "are better off financially" than their parents were "when they were your age." Seventy-four percent of Americans claim to be better off financially than their parents were, while nearly one in four (23%) say they are not better off.
3. WHO ARE THE HAVE-NOTS?
Not surprisingly, demographic and socioeconomic factors are strongly related to Americans' characterizations of themselves as haves and have-nots on the various measures included in this survey.
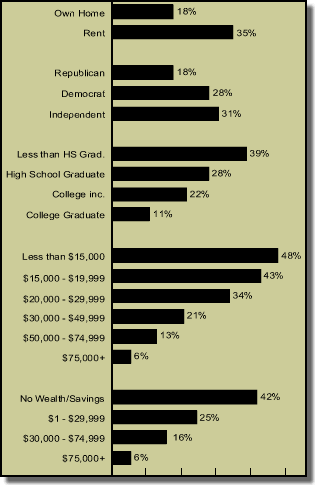
The proportion of Americans saying they are have-nots increases substantially as annual household income decreases, from 10% among those with incomes of $50,000 or more to 48% among those earning under $15,000. Still, the percentage describing themselves as have-nots is remarkably low among those at the lower reaches of the income distribution. Only half of those with household incomes below $10,000 consider themselves to be have-nots.
Educational attainment is similarly related to have/have-not status, with 11% of college graduates saying they are have-nots, compared with 22% of those with an incomplete college education, 28% of high school graduates, and 39% of those with less than a high school education.
Racial and ethnic minority status is also clearly associated with self-assessment as a have-not. More Blacks than Whites classify themselves as have-nots (38% versus 22%), and more Hispanics than non-Hispanics place themselves in this category (43% versus 22%).
These racial and ethnic differences are clearest at the lower end of the socioeconomic range. They decrease or disappear entirely among respondents whose income exceeds $50,000. In other words, there is no significant difference in self-reported have or have-not status by race or ethnicity among those in this upper income category.
Percent "Have-Not" by Selected Characteristics
Q12. If you had to choose, which of these groups are you in--the haves or the have-nots?
(n=5,001)
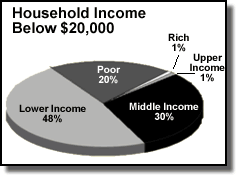
Self-reported financial situation varies by household income, as would be expected, but the differences are not dramatic. For example, relatively few Americans, regardless of income, accept the designation of "poor." Only 20% of those reporting income of less than $20,000 place themselves in this category, and this percentage rises only to 33% among those making less than $10,000. These individuals prefer to label themselves as "lower income" or "middle income."
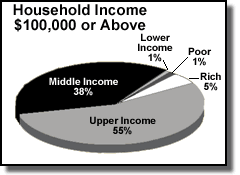
At the upper end of the spectrum, 38% of those making $100,000 or more still call themselves "middle income," while most of the rest accept the label "upper income." Only 5% of this group calls itself "rich."
Financial Situation By Selected Income Categories
Q9a. Thinking just about your own financial situation, do you consider yourself to be rich, upper income, middle income, lower income or poor?
According to the most recently available poverty estimates published by the U.S. Bureau of the Census (for 1997), 11% of the adult residential population in the U.S. lives in households that fall below the federally established poverty level. Children under 18 are nearly twice as vulnerable, with 20% of this population living in poverty.
Economic Deprivation By Demographic Groups--Trend
% "Yes, Not Enough for Food, Clothing, and/or Health Care"

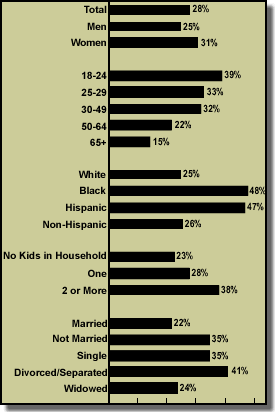
The Gallup data underscore this relationship between family structure and economic hardship. We examined deprivation and self-assessment as a have-not by the number of children in households, as well as by marital status:
- Respondents living in households with children are significantly more likely than those in households without children to report that they have experienced at least one economic deprivation in the last year (35% versus 23%).
- As the number of children in a household increases, so does the rate of experience of at least one economic deprivation- households with one child show a rate of 28%, compared to 38% for households with two or more children.
- Unmarried respondents were significantly more likely than married ones to suffer one or more of the three kinds of deprivation (35% versus 22%).
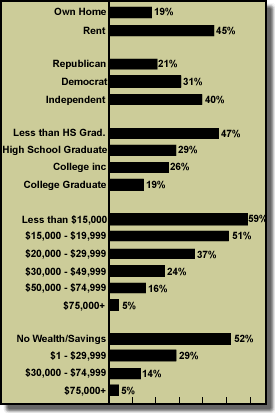
Demographic background characteristics are more strongly related to reported deprivation than to self-assessed have or have-not status. This may be due in part to the fact that deprivation is more narrowly economic in nature and, thus, more directly related to socioeconomic variables and to other variables correlated with socioeconomic status.
% Experienced at Least One Deprivation
(n=5,001)
4. PERCEPTIONS OF INEQUALITY: THE NATION
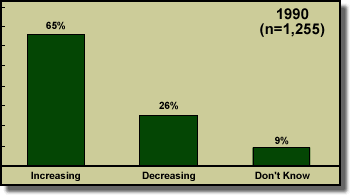
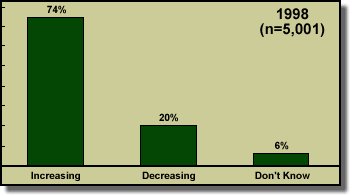
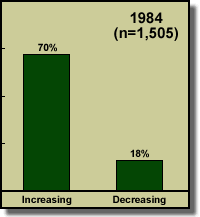
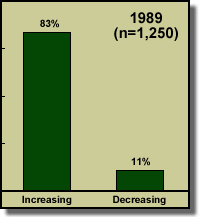
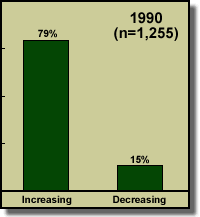
A large majority of Americans, 74%, currently believes that "the percentage of Americans who are rich is increasing from year to year." This represents an increase from the 65% who felt this way the first time the question was asked, in 1990.
Is the Percentage of Americans Who Are Rich Perceived to be Increasing or Decreasing--Trend
Q25. Would you say that the percentage of Americans who are rich is increasing from year to year, or decreasing from year to year?
Those who characterize themselves as "rich" or "upper income" are actually more likely to perceive an increase in the percentage of Americans who are rich than are those who consider themselves "lower income" or "poor" (80% compared to 71%). And those who have experienced deprivation (not enough money to pay for food, clothes, or health care in the past year) are less likely to perceive that the percentage that is rich is increasing than are those who have not experienced deprivation. People's perceptions thus appear to be filtered through the lens of their own experience but, perhaps contrary to expectations, there is not a tendency for those at the bottom end of the economic spectrum to be most sensitive to increasing numbers of Americans at the top end.
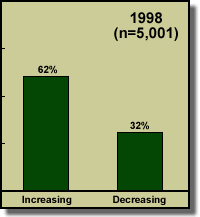
A majority of Americans also believes that the percentage of Americans living in poverty is increasing, although it is a slimmer majority than those who perceive an increase in the percentage that is rich. In addition, the trends for these two items over time are moving in opposite directions. The percentage saying that poverty is decreasing, 32%, is well above any previously recorded level (among 4 measurements taken over the last 14 years), and the percentage saying that poverty is increasing, 62%, is, correspondingly, the lowest point in the historical trend.
Thus, compared with earlier measurements, there is an apparent trend for Americans to be more likely to perceive expansion at the top end of the socioeconomic ladder and less likely to perceive it at the bottom end.
Is Percentage of Americans Living Below Poverty Line Perceived to Be Increasing or Decreasing--Trend
Q24. Would you say that the percentage of Americans living below the poverty line is increasing from year to year or decreasing from year to year?
These two questions-perceptions of the increase or decrease in the percentage of the country that is rich and the percentage that is poor-can be viewed in combination. The results suggest that a sizeable plurality of Americans, 45%, perceives that both the percentage of rich people and the percentage of poor people in the U.S. are increasing. This reflects the historically familiar tendency for Americans to assume that the percentages of Americans at both ends of the economic ladder are increasing. About one out of four Americans believes that the percentage of rich people is increasing at the same time that the percentage of poor people is decreasing. Only about half as many believe that the opposite pattern is occurring-that the percentage of rich people is decreasing while the percentage of poor people is increasing. Very few Americans believe that both rich and poor groups are decreasing.
Rich/Poor Increasing or Decreasing
Q24. Would you say that the percentage of Americans living below the poverty line is increasing from year to year, or decreasing from year to year?
Q25. Would you say that the percentage of Americans who are rich is increasing from year to year, or decreasing from year to year?
| % Rich Increasing | % Rich decreasing | Don't Know/Refused | Total | |
|---|---|---|---|---|
| % Poor Increasing | 45% | 14% | 3% | 62% |
| % Poor Decreasing | 26 | 6 | 1 | 32 |
| Don't Know/Refused | 3 | * | 2 | 6 |
| Total | 74 | 20 | 6 | 100 |
| Note: Rows and columns may not add to totals due to rounding. *Less than 1% |
||||
Another question asks about income distribution patterns in the U.S. in a more straightforward way: "Do you agree or disagree that 'Today, it's really true that the rich just get richer while the poor get poorer'?"
Sixty-nine percent of Americans agree with this statement, although this represents a decline from the 74%-78% agreement recorded in the late 1980s.
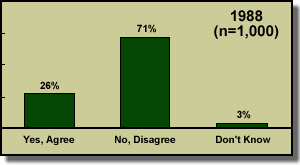
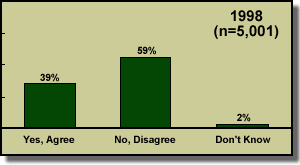
At the same time, there has been a 13-percentage-point increase in the percentage of Americans who agree that America is divided into haves and have-nots, based on a comparison of the 1988 survey to the current survey. Thirty-nine percent agree today, compared to 26% that agreed in 1988.
Is American Society Perceived as Divided Into "Haves" and "Have-Nots"--Trend Q11. Some people think of American society as divided into two groups--the "haves" and the "have-nots," while others think it's incorrect to think of America that way. Do you, yourself, think of America as divided into "haves" and "have-nots," or don't you think of America that way?
Despite these findings, only one fourth of Americans say that there are too many rich people in this country. Although this is up slightly from the 1990 percentage, so is the percentage saying there are too few rich people, which is now at 20%.
Thus, the survey evidence relating to Americans' perceptions of the social and economic state of the nation is mixed. Americans are significantly more likely to believe that the nation is divided into haves and have-nots than they were ten years ago, although the majority still denies that this description typifies American society today. The perception that there are increasing numbers of rich people in this country has become more prevalent in recent years while, at the same time, the perception that there are increasing numbers of poor people in this country has declined. Nevertheless, only a fourth of Americans say that there are too many rich people, while almost as many say that there are too few.
All of this suggests that the public's perception of the pattern of inequality in this country has two components: a) there is indeed more inequality, but b) this is driven to a greater degree by expansion at the upper end of the economic spectrum than it is by increases at the lower end.
5. OPINIONS ABOUT THE DISTRIBUTION OF ECONOMIC RESOURCES IN THE U.S.
There is a general tendency for Americans to perceive that the distribution of economic resources in this country is less fair than it should be, and that the fairness of the distribution should be improved. About one half of Americans, 52%, agree that the fact that there are rich people and poor people in the U.S. today "represents a problem that needs to be fixed," while a slightly lower number, 45%, say that this is an "acceptable part of our economic
Although self-described haves are much more likely than the have-nots to consider the disparity between rich and poor as acceptable, the haves are less accepting of this state of affairs than might be expected. Nearly half of them consider it to be a problem that needs to be fixed.
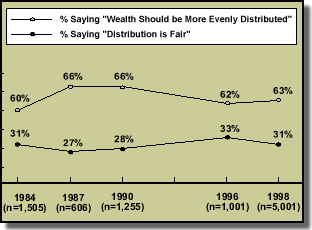
Additionally, a large majority of Americans, 63%, agrees that money and wealth in this country should be more evenly distributed. This belief in the need for at least some income and wealth redistribution has been a stable fixture of American public opinion over the past 14 years: the percentage of the public expressing this sentiment has remained within a narrow range, between 60 and 66 percent, since Gallup's first measurement in 1984.
Is Distribution of Money and Wealth in America Today Considered Fair or Not?--Trend
Q19. Do you feel that the distribution of money and wealth in this country today is fair, or do you feel that the money and wealth in this country should be more evenly distributed among a larger percentage of the people?
There are two other indications in this study that a sizeable proportion of Americans are dissatisfied with how economic outcomes are determined in the country today. Those who agree with the idea that the rich get richer while the poor get poorer tend to believe, in response to a follow-up question, that this is a bad rather than a good state of affairs. Additionally, those who believe that the country is divided into haves and have-nots also say, in response to a follow-up question, that this situation is a bad rather than a good thing.
Overall, these results provide evidence that Americans are at least somewhat uncomfortable with the economic inequality that currently exists in this country, and that they believe the fairness of the present system of economic reward distribution could and should be improved upon.
Belief that money and wealth in society should be more evenly distributed is strongly related to views of whether the U.S. is a nation divided into haves and have-nots. Three-quarters (77%) of adults who feel the U.S. is divided into these distinct groups say that money and wealth should be more evenly distributed, compared to just over half (54%) of those who do not feel the U.S. is divided in this way. More remarkable is how skeptically the fairness of the system is viewed by those who have most benefited from it. Even among the self-classified haves, a majority (59%) feels that money and wealth should be more evenly distributed.
Summary of Fairness Issues Based on Haves and Have-Nots
(Percentages based on self-described Haves and Have-Nots)
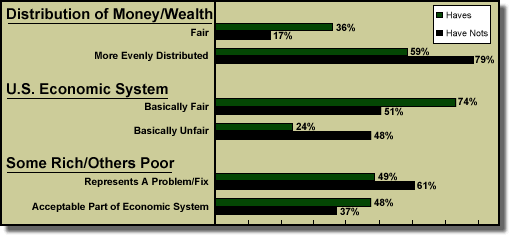
In summary, there is majority agreement with two general statements that argue in favor of at least some redistribution of money and wealth in America today. There is also a tendency for Americans to say that income inequality is increasing from year to year, and that the percentage of those beneath the poverty line is increasing. At the same time, there is little evidence of concern about expansion at the upper end of the spectrum-that is, the existence of too many rich people does not seem to be viewed as a problem.
6. PERCEPTIONS OF OPPORTUNITY IN THE UNITED STATES
Fairness of the System and the Possibilities for Getting Ahead. Despite Americans' concerns about the existence of inequality in the U.S. economic system, they express clear and strong beliefs that there is great equality of opportunity in this country, and that the chances to get ahead if one is willing to work hard remain very good.
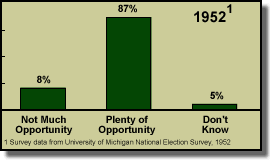
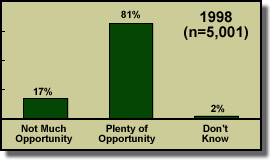
The statement that there is "plenty of opportunity and anyone who works hard can go as far as they want" is endorsed by an overwhelming 81% of Americans. The percentage that believes the opposite, that the "average person doesn't have much of a chance to get ahead" has doubled in the past 46 years-from 8% in 1952 to 17% now-but remains relatively low.
Opportunity for Average Person in America Today--Trend
Q34. Some people say there's not much opportunity in America today--that the average person doesn't have much chance to really get ahead. Others say there's plenty of opportunity and anyone who works hard can go as far as they want. How do you feel about this?
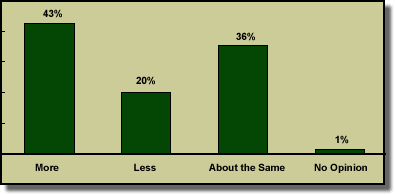
Additionally, opportunity to succeed in the U.S. is perceived to be expanding rather than contracting. Forty-three percent of Americans say "there is more opportunity to get ahead than there used to be," and another 36% say "the amount of opportunity is about the same." Only a minority (20%) in the current survey says "there is less opportunity than there used to be."
In response to a question about the fairness of the economic system in the U.S. (based on equality of opportunity to succeed), nearly seven in ten Americans (68%) say that the economic system in the U.S. is "basically fair, since all Americans have an equal opportunity to succeed," while less than three in ten (29%) perceive the system as "basically unfair, since all Americans do not have an equal opportunity to succeed."
Is Nation's Economic System Considered Fair or Unfair
Q28. Do you think the economic system in the United States 1) is basically fair, since all Americans have an equal opportunity to succeed, or 2) basically unfair, since all Americans do not have an equal opportunity to succeed?
(n=5,001)
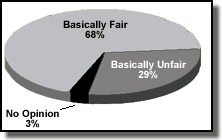
A striking aspect of answers to this question is their relationship to self-ascribed have/have-not status. One might anticipate that those who consider themselves have-nots would be disproportionately likely to consider the system unfair. Although there is a clear relationship in this direction, have-nots are perhaps less critical of the system than might be expected. In fact, those who call themselves have-nots are almost evenly divided on this question: 51% say the system is "basically fair" and 48% say it is "basically unfair." In addition, a majority of Americans who have experienced economic deprivation in the past year also perceive the U.S. economic system to be basically fair (54%). Furthermore, 62% of those who feel that poverty in the U.S. is increasing believe the economic system is basically fair.
Is the Amount of Opportunity in America Believed to be More or Less Than in Past
Q34a. Is there more opportunity in America today for the average person to really get ahead than there used to be, less opportunity for the average person to really get ahead, or is the amount of opportunity about the same?
(n=5,001)
Perceptions of fairness of the U.S. economic system are strongly related to perceptions of whether or not there has been an increase or a decrease in the percentage of Americans living in poverty. Across a variety of measures, those who view the system as unfair are substantially more likely than those who view the system as fair to see poverty as increasing. The fact that these same fairness questions are not related to perceptions of change in the percentage of the country that is rich suggests that the existence of poverty may be more central to the issue of fairness in the minds of Americans than is the disparity between rich and poor.
In summary, there is a strong belief in the pervasiveness of opportunity in the U.S. today. Strong majorities of the public feel there is opportunity for those who want to get ahead, and feel the system is fair. In addition, when asked about changes in this opportunity structure, Americans by a greater than two-to-one margin say that opportunities for the average American to get ahead are greater now than they have been in the past.
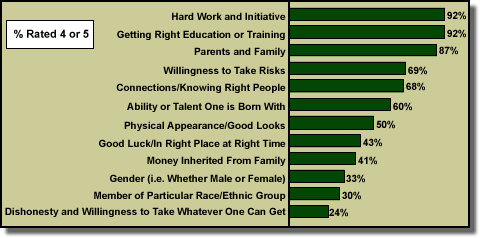
The perception that opportunity is there for those who want to take advantage of it is underscored by answers to a series of questions asking respondents to rate the importance of each of twelve factors in determining why some people in this country get ahead in life and others do not.
The results show that Americans believe that the primary determinants of success are merit-based. The two dimensions perceived by Americans to be most important in determining why some people get ahead are "hard work and initiative" and "getting the right education or training." The third most highly ranked factor, "parents and the family environment they grew up in" stands out as the single most important determinant of success that can be classified as outside of one's control.
In identifying "family" as a major factor, Americans may be acknowledging some element of luck in the mix of things that contribute to success. However, the fact that ability or talent ranks well below family in importance, suggests that Americans are thinking of something other than genetics in identifying the importance of family. The paramount importance of "hard work" may be a clue that the perceived importance of family has more to do with the values and work ethic instilled after birth, than with mental capacities or other attributes inherited at birth.
"Connections and knowing the right people" is ranked in the top half of the twelve factors, but who you know still ranks far below what you know (getting a good education) and what you do (hard work and initiative). Three factors-willingness to take risks, native ability or talent, and physical appearance-are ranked in the middle range.
At the bottom of the list are five factors that could be considered indicative of an unfair system of opportunity: dishonesty (the lowest rated of the twelve factors by a wide margin), being a member of a particular race or ethnic group, gender, inherited money, and luck or being in the right place at the right time.
Gender ranks tenth overall, and does so even among women.
The importance of race or ethnicity ranks eleventh out of the twelve factors tested, ahead only of dishonesty. It is tied for twelfth place among Whites. Even among Hispanics and African Americans, this factor is regarded as relatively unimportant (ranking eleventh among Hispanics and tenth among African Americans). In fact, for both of these minority groups, "physical appearance and good looks" achieves higher ratings than "being a member of a particular race or ethnic group."
Perceived Reasons Why Some People Get Ahead and Succeed in Life
Q29. I am going to read several reasons why some people get ahead and succeed in life and others do not. Using a one-to-five scale, where "1" means not at all important, and "5" means extremely important, please tell me how important it is as a reason for a person's success. You can choose any number from one to five.
(n=5,001)
Blame for Poverty and Credit for Wealth
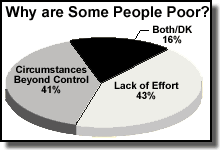
In light of all of the findings that Americans perceive hard work to be the most important determinant of success, it may be somewhat surprising that Americans seem relatively reluctant to ascribe blame for poverty to lack of effort. In general, Americans do not appear to be ruthless in holding poor people accountable for their situation, nor highly generous in giving wealthy people credit for their own success. Overall, just over half of respondents (53%) attribute success to strong effort, and just under half (43%) blame poverty on lack of effort. In other words, Americans are somewhat more likely to attribute economic failure to factors beyond the individual's control than to lack of effort, and more likely to attribute economic success to hard work than to factors outside the individual's control.
Answers to the "blame for poverty" question have varied over the last several decades, favoring "lack of effort" by a substantial plurality in the mid-to-late 1960's, then shifting toward a plurality favoring the "circumstances beyond his/her control" explanation in 1989 and 1990. The tendency to ascribe success more to effort than luck in the current survey was also evident at the only other time the question was asked, in 1990.
Reasons for Being Poor, Being Rich
Q20a. Why are some people poor?
(n=5,001)
Q21a. Why are some people rich?
(n=5,001)
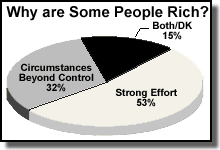
It is difficult to be certain whether this pattern is best understood as simply rooted in sympathy for the downtrodden, or whether it reflects the perception that circumstances beyond a person's control provide more of a "drag" on those at the bottom of the socioeconomic spectrum than a "boost" to those closer to the top. Women are substantially more likely than men to attribute poverty to circumstances (46% vs. 35%), while there is no gender gap in attributions of wealth. Have-nots (whether defined by self-assessment, reports of deprivation, or household income) are more likely to attribute both wealth and poverty to circumstances than are haves.
7. ATTITUDES ABOUT WHAT SHOULD BE DONE TO HELP THE HAVE-NOTS
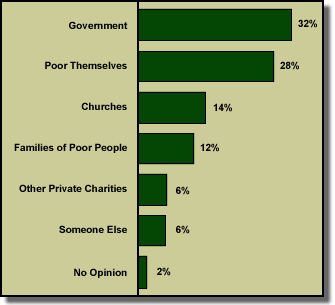
Remedies: What Should Be Done About Inequality Today? Americans tend to look first to the government for solutions to the problem of poverty, but the percentage that says the poor should help themselves has increased significantly over the last nine years, while the percentage in favor of government help has declined. Thus, while, in 1989, 36% of the public believed that the government should help the poor, and only 18% said the poor should help themselves, these percentages are more nearly balanced today, with 32% saying the government should help, and 28% saying the poor should help themselves. The percentage that says the church should help the poor has declined slightly, from 19% in 1989 to 14% in the current survey.
Which Group in Society Should Have the Greatest Responsibility for Helping the Poor?
Q33. Which one of the following groups do you think has the greatest responsibility for helping the poor: churches, other private charities, the government, the families and relatives of poor people, the poor themselves, or someone else?
(n=5,001)
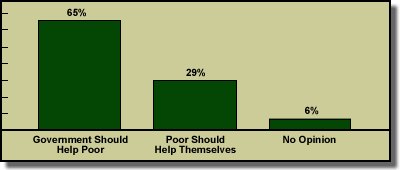
At the same time, in response to a simpler, forced choice question, Americans are more likely-by a two-to-one margin-to say the government should make every possible effort to improve the social and economic position of the poor, than they are to claim that the government should not be involved because the poor should help themselves.
Should Federal Government Make Special Effort to Improve Social and Economic Position of Poor or Not
Q36. Some people feel that the government in Washington, DC should make every possible effort to improve the social and economic position of the poor. Others feel that the government should not make any special effort to help the poor, because they should help themselves. How do you feel about this?
(n=5,001)
What is it exactly that the government should be doing to help the poor? When this is asked in a follow-up question, the public comes down on the side of indirect training and education rather than direct "income transfer" programs.
What Government Should Do to Help Poor
Q37. Just your opinion, in what ways do you think the government should help the poor?
| % | |
|---|---|
| Income Transfer | |
| Financial aid, give money | 12 |
| Tax breaks, lower taxes | 5 |
| Raise minimum wage | 2 |
| Education Training | |
| Better Education | 38 |
| More job and skills training | 29 |
| More Opportunity | |
| More jobs and job opportunities | 16 |
| Better jobs | 3 |
| More opportunities | 3 |
| Other | |
| More housing | 11 |
| Better health care coverage | 10 |
| Better child care | 7 |
| More social programs and services | 6 |
| Note: Totals adds to more than 100% due to multiple responses | |
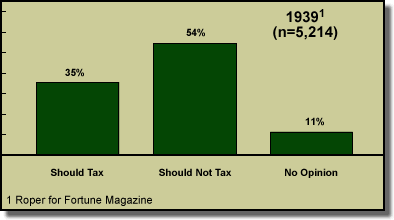
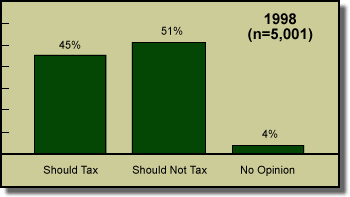
What about government efforts to limit wealth among those at the upper end of the economic spectrum? Americans are surprisingly willing to tax the rich heavily in order to "redistribute wealth." In fact, this sentiment is more prevalent today than it was in 1939, in the late years of the Great Depression. Nearly half of Americans today agree that the government should redistribute wealth by heavy taxes on the rich. Only a third agreed with this sentiment in 1939.
Support for Redistributing Wealth by Means of Heavy Taxes on the Rich
Q35. People feel differently about how far a government should go. Here is a phrase which some people believe in and some don't. Do you think our government should or should not redistribute wealth by heavy taxes on the rich?
Americans' Outlook on Broader, National Conditions
A clear majority of Americans, 58%, expresses "satisfaction with the way things are going in the United States at this time." Historically, responses to this question have been much more volatile than were responses to the more personally focused satisfaction questions described earlier. Satisfaction with the way things are going in the United States has ranged from a low point of 12% claiming satisfaction in 1979 to a high point of 66% in 1991. The current level of 58% is toward the high end of the historical trend, but is significantly below the high water mark of 66% recorded in 1991, immediately after the Gulf War.
Over half of American adults (55%) characterized economic conditions in this country as either "excellent" (12%) or "good" (43%) at the time of this survey (April-May 1998). The percentage expressing this positive outlook has been climbing rapidly over the period covered by our historical trend. Gallup began asking this question in its present form in 1992, and has asked it 31 times during the intervening six-year period. Ten measurements were taken in 1992 and 1993 before the combined "excellent" and "good" responses broke the 20% threshold, although since the middle of 1996, this percentage has routinely exceeded 40%.
The Public Rates the Nation's Economy Today--Selected Trend
Q8. How would you rate economic conditions in this country today--as excellent, good, only fair, or poor? (One measurement selected per year since question first asked)
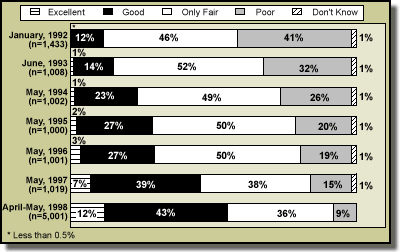
Americans seem to view economic conditions through the lens of their own experience. Self-reported income, wealth, and financial situation all bear clear relationships to perceptions of economic conditions. Fully 75% of those who characterize themselves as either "rich" or "upper income" rate economic conditions as either excellent or good, compared with only 29% of those who classify themselves as "poor."
8. SAVINGS HABITS: THE FUTURE OF ECONOMIC INEQUALITY
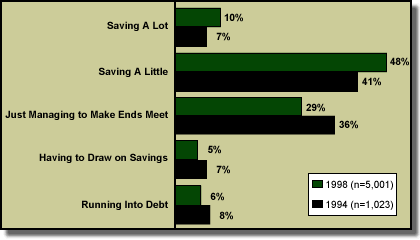
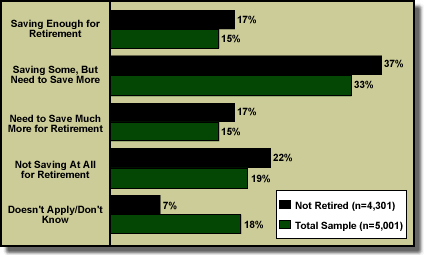
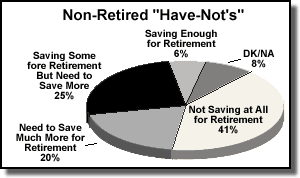
As described previously, only one-quarter of the nation's adults, in one way or the other, describe themselves as have-nots. Yet when Americans are asked to describe their own savings habits, only 58% claim to be saving at least a little, and 40% are either just managing to make ends meet, are drawing on savings, or are in debt. Another question about retirement planning supports this finding. Focusing only on those who are not already retired, only 17% feel that they are saving enough for retirement, while 37% say they are saving some, but need to save more. Nearly four in ten pre-retirees report that they are either not saving at all for retirement (22%), or need to save much more (17%).
Assessment of Current Household Financial Situation Regarding Savings and Debt--Trend
Q17. Which of these statements best describe the current financial situation in your household--you are saving a lot, you are saving a little, you are just managing to make ends meet on your income, you are having to draw on your savings, you are running into debt?
Household Savings for Retirement: Sufficient or Not?--Trend
Q18aA. For those of working age in your household, would you say they are saving enough for retirement, they are saving some for retirement, but need to save more, they need to save much more for their retirement, they are not saving at all for their retirement?
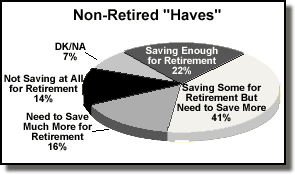
Combining these findings with what we know about the impending wave of baby-boomers soon to reach retirement age, and what we don't know about the future of the U.S. economy, it seems quite possible that by the time this survey is repeated early in the next decade, the ranks of the have-nots will have expanded significantly. In our current survey, 23% of self-described "haves" report that they are just managing to make ends meet, and 8% of these adults are in debt or are drawing on savings. Moreover, among the pre-retirees surveyed, nearly one in three self-described "haves" reports that he or she either needs to save much more for retirement (16%), or is not saving at all (14%).
Saving Habits of the Non-Retired "Haves" and "Have-Nots" Q18aA. For those of working age in your household, would you say they are saving enough for retirement, they are saving some for retirement, but need to save more, they need to save much more for their retirement, they are not saving at all for their retirement?
Design of the Sample
The 1998 Gallup Poll Social Audit on "Haves and Have-Nots: Perceptions of Fairness and Opportunity," is the first in a series of periodic assessments on this topic as part of the Gallup Poll Social Audit series. Between April 23 and May 31, 1998, interviews were conducted by telephone with 5,001 adults selected from households in the continental United States.
The telephone sample was obtained from Survey Sampling, Inc. The survey design included an oversampling of telephone exchanges estimated to contain relatively low-income households. The estimates of income, calculated by Survey Sampling, Inc., are derived from analysis of more than 200 variables, including both household data and 1990 census data at the block group level.
Statistical weighting adjustments were applied in the analysis of the data, in order to correct the disproportional sampling design. Specifically, weighting factors were applied to respondents' data records to bring undersampled and oversampled telephone exchanges back into their correct relative proportions.
Calling Design
The survey employed a calling design that required interviewers to make a minimum of five dialing attempts (as necessary) in order to complete an interview with a selected adult within the household.
Respondent Selection
The "most recent birthday" method was used to randomize the selection of a respondent within the household. When a household was contacted, interviewers asked to speak with the adult in the household with the most recent birthday. If this person was not home, interviewers attempted to ascertain when the respondent would be available, and scheduled a call for that time. Prior to household contact, or in the absence of information about the availability of the selected respondent, calls were scheduled according to a computerized algorithm designed to maximize the probability of household contact.
A final disposition was coded for all telephone numbers dialed, and the distribution of these dispositions is available upon request. Interviewers gained cooperation in 56% of households contacted. The overall response rate for the survey, using the conservative formula developed by the Council of American Survey Research Organizations (CASRO), is estimated to be 40%.
Weighting
The data collected for this survey have been weighted to allow for the projection of survey conclusions to the population of adults living in telephone households in the continental United States. Two kinds of weighting adjustments were employed for this survey. As mentioned above, sampling weights were applied in order to correct for disproportionality in the sampling of telephone exchanges. Additional sampling weights were applied to correct for inequalities in telephone households related to the number of voice lines into the household, and for disproportional representation of households with varying numbers of resident adults (since only one adult was selected to be interviewed, regardless of the number residing in the household). A second type of weighting factor was applied, in order to bring the demographic characteristics of respondents in the final weighted sample of completed interviews into alignment with estimates obtained in the annual Current Population Survey (CPS), conducted by the U.S. Bureau of the Census. The sample was adjusted to conform to CPS targets for household size, gender, age, education, race, Hispanic ethnicity and census region. Final weighting factors range between 1 and 7.
Survey Design and Statistical Precision of Survey Estimates
Although the sample design involved stratification, a strategy that generally improves the precision of survey estimates (i.e., leads to a reduction in estimates of the "margin of sampling or random error"), the weights applied to correct the disproportionate design of the sample and to align the demographic characteristics of the sample of completed interviews led to variances that exceed those associated with simple random samples of the same size. An overall "design effect" was calculated for the survey in order to account for the effects of sample design on the precision of survey estimates. The square root of this design effect can be used as a simple multiplier to inflate simple random sample estimates of standard errors, when employing tests of statistical significance. The inflation factor for the sample is estimated as 1.09. The resulting estimate of the maximum margin of sampling error for percentages at the 95% level of confidence is ± 2 percentage points for the total national sample.