GALLUP NEWS SERVICE
Q1: What is the status of the presidential race right now?
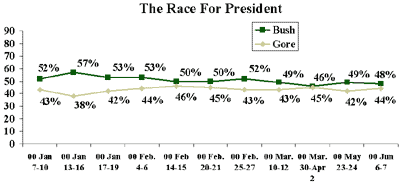
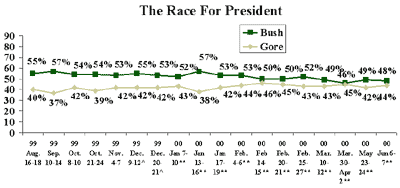
According to the latest Gallup poll, conducted June 6-7, 2000, Republican George W. Bush leads Democrat Al Gore 48% to 44% among likely voters. Bush has led throughout the year, by between one and nine percentage points, and since February he has averaged a 6-point lead.
Q2: How does Bush’s current lead compare with front-runners in previous elections?
The obvious question raised by George W. Bush’s current lead in the polls is the relationship between that lead and a possible Bush victory in November. Bush currently leads Al Gore by four percentage points, based on a Gallup survey conducted June 6-7. An analysis of Gallup historical trends shows that the status of the presidential race in June, in and of itself, is not necessarily indicative of the outcome in November.
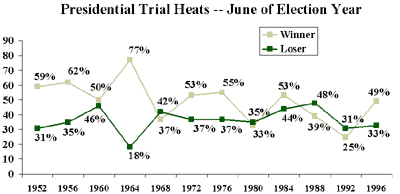
As shown in the chart below, among the twelve presidential elections held from 1952 through 1996, in four of them -- 1968, 1980, 1988, and 1992 -- the candidate who eventually won the election was running behind in the polls during June of the election year. Specifically:
- In June 1992, Bill Clinton trailed President George Bush, at a time when Reform Party candidate Ross Perot was still a serious contender in the race.
- In June 1988, Vice President George Bush trailed Michael Dukakis by nine percentage points, but eventually won the election by seven points.
- In June 1980, Ronald Reagan trailed incumbent President Jimmy Carter by 2 points then went on to win the election by ten points.
- In June 1968 Richard Nixon lagged five points behind Hubert Humphrey, then won the election by just under 1 percentage point.
Even in years when the June pre-election result showed the winning candidate ahead, the margin of that lead in June was generally different from the margin of the candidate’s win in November. In two cases, 1972 and 1984, the race was significantly closer in June than it ultimately proved to be on Election Day. In five cases, 1996, 1976, 1964, 1956 and 1952, the race margin was significantly wider in June than it was in the end. Only in 1960 did the winning candidate lead in June by a margin similar to that which he eventually won by in November.
|
Poll Results in June of Election Year |
Election |
||||||
|
Winner |
Loser |
June Gap |
Actual Gap |
Difference |
Winner |
Loser |
|
|
1996 |
49 |
33 |
16 |
8 |
8 |
Clinton |
Dole |
|
1992 |
25 |
31 |
-6 |
6 |
-12 |
Clinton |
Bush |
|
1988 |
39 |
48 |
-9 |
7 |
-16 |
Bush |
Dukakis |
|
1984 |
53 |
44 |
9 |
18 |
-9 |
Reagan |
Mondale |
|
1980 |
33 |
35 |
-2 |
10 |
-12 |
Reagan |
Carter |
|
1976 |
55 |
37 |
18 |
2 |
16 |
Carter |
Ford |
|
1972 |
53 |
37 |
16 |
23 |
-7 |
Nixon |
McGovern |
|
1968 |
37 |
42 |
-5 |
0.7 |
-5.7 |
Nixon |
Humphrey |
|
1964 |
77 |
18 |
59 |
22 |
37 |
Johnson |
Goldwater |
|
1960 |
50 |
46 |
4 |
0.2 |
3.8 |
Kennedy |
Nixon |
|
1956 |
62 |
35 |
27 |
15 |
12 |
Eisenhower |
Stevenson |
|
1952 |
59 |
31 |
28 |
11 |
17 |
Eisenhower |
Stevenson |
While informative, this snapshot analysis of the relationship between June polls and the November outcome does not tell the whole story. Some races are more volatile than others, with the lead switching back and forth between candidates throughout the primary and pre-convention months, and in some cases throughout the entire election year. The best example of this is 1960, when the race was between Richard Nixon and John F. Kennedy. That year the gap in support for the two candidates varied in a tight range of only zero to seven points, and the lead switched at least eight times between January and November. While Kennedy was leading Nixon by a small margin in June of 1960, Nixon regained the lead after the conventions in late July, lost the lead in August, and gained it again in September. Thus, although the final election results were roughly comparable to the June polling results, the race underwent significant changes in the intervening months.
In contrast, the 2000 election has been markedly consistent. Although Bush’s lead has fallen substantially from double digits to single digits, he has nevertheless held the lead over Gore in every Gallup survey from the first time Gallup tested his candidacy in May 1998. Bush has led Gore in 31 Gallup pre-election trial heat surveys since that time, including all 13 trial heats measured this year.
A different question one might ask would be, "Has a candidate ever prevailed in all surveys leading up to June of election year, and then gone on to defeat?"
Examples of such early dominance by one candidate include several incumbent presidents in their year of re-election: President Reagan in 1984, President Carter in 1980, President Nixon in 1972, President Johnson in 1964 and President Eisenhower in 1956. Additionally, once Jimmy Carter and Michael Dukakis emerged as the Democratic nominees in the respective elections of 1976 and 1988, each led his general election opponent in all surveys through June (and, in fact, beyond). Of the seven candidates in this early front-runner category, all ultimately prevailed in the fall election except for Carter in 1980 and Dukakis in 1988.
In 1972, 1964, 1956 and 1952 the front-runner enjoyed larger leads, on the order of 10 to 50+ points. In 1980 and 1984 the race was more competitive, with the candidates generally within 10 points of each other. In 1980 Carter, the early front-runner, lost and in 1984 Reagan won.
Given the close nature of the Bush-Gore race this year, even Bush’s consistent pattern of leading in Gallup surveys is no guarantee that he will sail to victory in November.
GALLUP NEWS SERVICE
Q3: How important will third party candidacies be in the election?
In addition to the Republican and Democratic parties, three minor political parties are in a position to field national candidates in the 2000 election this fall and, at least theoretically, have the potential to draw a substantial number of votes. In order of past election performance, these are the Reform Party, the Green Party, and the Libertarian Party. Even if the nominees of these parties don’t win the election, such third party candidacies can impact the outcome of the election by disproportionately drawing votes away from one or the other major party candidates.
The three likely nominees for these parties in the 2000 election are Pat Buchanan for the Reform Party, Ralph Nader for the Green Party, and Harry Browne for the Libertarian Party. In 1996, Ross Perot carried the mantle for the Reform Party, garnering 8.5% of the national vote, Nader earned 0.7% as the Green Party candidate, and Browne drew 0.5% on the Libertarian Party line. Thus, to the degree that past history forecasts the future, Nader and Browne would not be predicted to receive a large number of votes. This is Buchanan’s first experience as the (expected) Reform Party nominee -- or as the presidential nominee for any party -- so it is unclear how strong he will be. At the same time, there are indications that Nader will be energetically campaigning this year, which may prove significant because the Reform party ticket (with Perot, not Buchanan, as its presidential nominee) has received up to 19% of the vote (1992).
In order to fully understand the degree of potential voter support for these candidates, Gallup has thus far measured this year’s multi-candidate presidential race in three separate ways:
- One is entirely open-ended, asking Americans who they plan to vote for in the election this fall, without prompting them with the names of any candidates.
- Another method is closed-ended, offering Americans the names of several third party candidates in addition to Bush and Gore.
- The third method is also closed-ended, this time offering just the names of Buchanan and Nader in addition to Bush and Gore.
In the open-ended format, used in a May 5-7 poll, Nader’s name was volunteered by 1% of Americans, while Buchanan and Browne were mentioned by fewer than 0.5% of Americans. Together, Bill Clinton and John McCain -- neither of whom will be presidential candidates this fall -- were actually mentioned by more respondents in this format than the three legitimate third party contenders.
Thinking about the election for president this year, which one of the candidates running for president do you plan to vote for in November?(Open-ended)
|
2000 May 5-7 |
|
|
% |
|
|
George W. Bush/Republican Party |
35 |
|
Al Gore/Democratic Party |
28 |
|
Ralph Nader/Green Party |
1 |
|
Bill Clinton |
1 |
|
John McCain |
1 |
|
Pat Buchanan/Reform Party |
* |
|
Alan Keyes |
* |
|
Harry Browne/Libertarian Party |
* |
|
Other |
* |
|
None |
8 |
|
No opinion |
26 |
Voter support for third party candidates increases from a total of 3% in this unaided question, to a total of 8-9% when the candidate’s names are read on the phone as part of a closed-ended ballot. In mid-May, Gallup asked a closed-ended question including the names of Ralph Nader, Pat Buchanan, Harry Browne, John Hagelin and Howard Phillips, along with Bush and Gore. Support for Nader and Buchanan increased 2 points each, while support for Browne, Hagelin and Phillips increased from minimal mentions to roughly 1 percentage point each.
I'm going to read a list of seven candidates for president who will appear on the ballot in a significant number of states this November. Supposing that all of these candidates were on the ballot in your state, which one would you be most likely to vote for – [ROTATE: Al Gore, the Democratic Party candidate; George W. Bush, the Republican Party candidate; Pat Buchanan, the Reform Party candidate; Harry Browne, the Libertarian Party candidate; Ralph Nader, the Green Party candidate; John Hagelin,the Natural Law Party candidate; or Howard Phillips, the Constitution Party candidate] or will you be voting for someone else?
(IF UNSURE)As of today which one of these candidates do you lean toward?
|
2000 May 18-21 |
|
|
% |
|
|
George W. Bush/Republican |
45 |
|
Al Gore/Democratic |
38 |
|
Ralph Nader/Green Party |
3 |
|
Pat Buchanan/Reform Party |
2 |
|
Harry Browne/Libertarian Party |
1 |
|
John Hagelin/Natural Law Party |
1 |
|
Howard Phillips/Constitution Party |
* |
|
John McCain (VOL.) |
1 |
|
Someone else |
1 |
|
No opinion |
8 |
Additionally, Gallup has twice measured a 4-way presidential ballot, which included the names of Buchanan and Nader along with Gore and Bush. In each case, the third party candidates received a combined total of 8% of the vote, compared to less than 2% in the unaided format.
Now suppose that the presidential election were being held today, and it included Al Gore as the Democratic candidate, George W. Bush as the Republican candidate, Pat Buchanan, as the Reform Party candidate, and Ralph Nader as the Green Party candidate. Would you vote for -- [RANDOM ORDER: Al Gore, the Democrat; George W. Bush, the Republican candidate; Pat Buchanan, the Reform Party candidate; (or) Ralph Nader, the Green Party candidate?]
[IF UNSURE] As of today, do you lean toward Gore, the Democrat, Bush, the Republican, Buchanan, the Reform Party candidate, or Nader, the Green Party candidate?
|
Al |
George W. Bush |
Pat Buchanan |
Ralph Nader |
Other |
No opinion |
|
|
Likely Voters |
||||||
|
2000 Jun 6-7% |
41 |
46 |
2 |
6 |
* |
5 |
|
2000 Apr 28-30% |
41 |
47 |
4 |
4 |
1 |
3 |
These procedures underscore the relevance of third party candidates on state ballots across the country. Both Buchanan and Nader are currently engaged in state-by-state petition drives to earn mention on the fall election ballots. Nader is currently on the ballot in only 14 states and is still running petition drives in the others. Buchanan is aggressively pursuing petition drives in all 50 states and is reportedly more than halfway to his goal. The Libertarian Party is well organized and says it is on track to appear on the ballot on all 50 states for the third consecutive presidential election
Regardless of ballot status, the recent track record of the Green Party, the Libertarian Party, the Natural Law Party and the Constitution Party suggests that no third party candidate will receive more than 1% of the national vote without some extraordinary change in campaign intensity on their part, or perhaps in voter mood. Occasional strong third party contenders such as John Anderson in 1980 and Ross Perot in 1992 and 1996 can break through the third party barrier and capture significantly higher support, but thus far in 2000 it is not clear that any of the minor party contenders have that kind of appeal. Still, the combined 8% of the vote obtained by Nader and Buchanan suggests the potential for greater third party support this year than the 1-2% they usually receive.
Q4: How will third party candidates affect support for Bush and Gore?
There are two ways to look at the impact third party candidates could have on the major party contenders for president this year. One approach is to look at their national impact as measured in surveys like the Gallup Poll. The other approach is to look at their potential impact on Electoral College votes, as measured in a state-by-state analysis of the strength of each candidate. There is particular speculation this year that a strong Nader candidacy in California could draw vital votes away from Gore, allowing Bush to win the state, and possibly throw the entire national election to Bush.
Gallup is examining the national scene. Voter support for third party candidates is currently having no major effect on the Bush-Gore race. This is evident in a comparison of the gap between Bush and Gore with Nader and Buchanan included in the race, versus a Bush-Gore race with Nader and Buchanan excluded. Bush leads Gore by 4% without Nader and Buchanan, and leads by 5% with Nader and Buchanan included on the ballot.
|
June 6-7, 2000 -- Based on Likely Voters
|
||
|
2-Way Ballot |
4-Way Ballot |
|
|
% |
% |
|
|
George W. Bush |
48 |
46 |
|
Al Gore |
44 |
41 |
|
Ralph Nader |
-- |
6 |
|
Pat Buchanan |
-- |
2 |
|
Other (VOL.) |
1 |
* |
|
No opinion |
7 |
5 |
|
Bush Lead |
4 |
5 |
The following chart shows the 4-way ballot from the combined April and June polls according to the party affiliation of likely voters. This indicates that Buchanan and Nader enjoy roughly equal levels of appeal among Republican voters (3% each) and pure independents (those that lean to neither party), and that Nader is stronger than Buchanan among Democrats (6% vs. 2%). Thus if Nader and Buchanan are able to build voter support, and if these partisan patterns hold as their vote totals increase, Nader may have the potential to be a greater threat to Al Gore than Buchanan is to George W. Bush. (Of course, Nader’s impact could be even larger if it is concentrated in certain states like California, rather than if it is evenly dispersed across the country.)
|
April/June 2000
|
|||
|
Republican |
Independent |
Democrat |
|
|
% |
% |
% |
|
|
George W. Bush |
86 |
22 |
9 |
|
Al Gore |
5 |
25 |
80 |
|
Ralph Nader |
3 |
13 |
6 |
|
Pat Buchanan |
3 |
10 |
2 |
|
Other (VOL.) |
1 |
3 |
* |
|
No opinion |
2 |
27 |
3 |
GALLUP NEWS SERVICE
Q5: Didn’t Bush have a much larger lead last year? What happened?
Bush did have as much as a 20 percentage point lead last year over Gore, reaching the high point in a September 10-14, 1999 poll. Bush entered the year 2000 with an 11 percentage point lead, a lead that has recently narrowed.
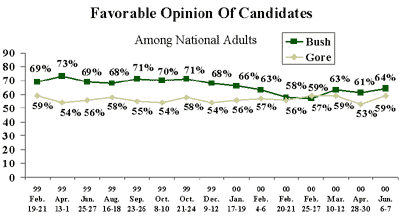
Gallup poll data show that George W. Bush is viewed less favorably today than he was a year ago (see chart below). In the earlier stages of a campaign, a candidate new to the political scene tends to get only good press, or in some cases no press, so voters’ perceptions are based on very little information. Over time, the candidates get more media attention regarding their campaigns or their previous personal and political conduct, which may begin to tarnish their images. During the Republican primary season, George W. Bush had to endure a brief but spirited challenge from John McCain, which included losses in the key states of New Hampshire and Michigan. In response to McCain’s challenge from the left/middle of the party, Bush espoused more conservative positions in South Carolina, which may have turned off moderate voters. Bush recovered to win the nomination and has since, according to observers, tried to move back toward the center of the political spectrum but the primaries may have had a negative impact on his formerly formidable image. Additionally, in a broader sense, Bush has become better known and better defined as the Republican candidate, and thus in some ways has inherited negative perceptions from members of the opposite party, which almost always happens. In short, Bush has gone from being a positively rated newcomer to a well-known politician in a competitive partisan environment.
Conversely, Al Gore has long been on the American political scene and has been especially prominent during the last eight years while serving as Bill Clinton’s vice-president. Voters perhaps have a fairly well defined view of Gore in their minds, and little of the new information they may encounter about him is likely to change their perceptions very much.
Support for the assumption that Bush has become a more "normal" candidate can be derived from an analysis of how each candidate fares now among partisan groups, compared to six months ago. In a December 9-12 poll, 20% of Democrats and 56% of independents (among registered voters) indicated they would vote for Bush if the election were held that day. Currently, only 9% of Democrats and 30% of independents support Bush (though many of the independents have moved to the ‘unsure’ category). Gore never received much support from Republicans, getting only 6% today and 8% in December. In December, only 22% of independents favored Gore and that proportion has slipped to 15% today (again, many more independents are unsure today than in the past).
GALLUP NEWS SERVICE
Q6: How does the presidential race look, based on the distinct voting patterns of Republicans, Democrats, and independents?
Much of the scholarly literature on elections has demonstrated that party orientation is the single best predictor of vote choice. For most people, party affiliation is a relatively long term commitment, largely a reflection of one’s political orientation when one first became involved in politics and/or voting, and often greatly influenced (though not "determined") by the political orientation of parents or guardians.
Generally, this means voters first choose their political party -- in fact, have chosen it in most cases long before this election campaign -- and then choose the presidential candidate who represents the party of their choice. It is unlikely, except for first-time voters -- who naturally tend to be the youngest group of voters -- that people first choose the presidential candidate, and then choose the party with which that candidate is affiliated.
With this in mind, it is useful to look at two questions: How many Republicans and Democrats are there? How do Bush and Gore fare among voters compared by party affiliation? (For this analysis, all independents who "lean" to one party or the other are classified with that party.)
1. Party Affiliation
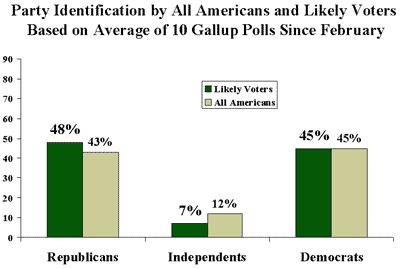
An average of the 10 polls conducted by Gallup since February shows that:
- Among Americans overall, Democrats slightly outnumber Republicans by 45% to 43%.
- Among likely voters, Republicans outnumber Democrats by 48% to 45%.
- The main difference: there are more Republicans (+5 percentage points) and fewer independents (-5 percentage points) among likely voters than among the population overall.
- Vote for Bush and Gore Compared by Party Affiliation
The 10 polls conducted by Gallup since February show Bush leading Gore among likely voters by anaverageof six percentage points,50% to 44%.
- Among Republican likely voters, Bush leads Gore by 89% to 7%.
- Among Democratic likely voters, Gore leads Bush by 85% to 10%.
- Among independent likely voters, Bush leads Gore by 35% to 25%.
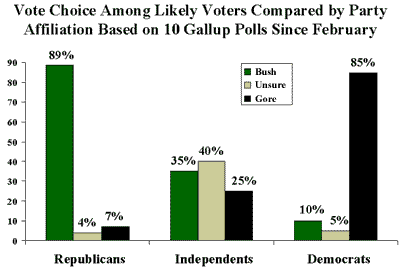
Thus, one way to describe Bush's lead over Gore is as follows:
- Most voters -- 81% -- at this point in the election campaign are voting along party lines.
- There are slightly more Republicans (48%) than Democrats (45%) among likely voters.
- Republicans are slightly more loyal to their party's presumptive nominee than are Democrats to their party's presumptive nominee (see chart above).
- Among the 7% of likely voters who say they are independent, Bush leads by 10 percentage points.
- All of these advantages for Bush translate into the average 6-point lead that he has enjoyed since February.
Party Analysis of 1996 Election Results
A similar analysis of the 1996 election shows that the factors that currently favor Bush over Gore -- party distribution, party loyalty, and strength among independents -- favored Clinton over Dole. (This analysis is based on Gallup's last pre-election poll in the two days leading up to the election, which showed Clinton leading Dole by 8 percentage points, 48% to 40%. The actual election results gave Clinton 49% and Dole 41% of the vote, suggesting the poll was an accurate indicator of the actual voting in 1996.)
- In the 1996 election, most people (78%) voted along party lines -- very similar to the number who do so in current election polls.
- In1996, there were more Democrats who turned out to vote (48%) than Republicans (43%) -- the opposite trend of today's results, where Republicans outnumber Democrats among likely voters.
- Democrats in 1996 were slightly more loyal to their party's candidate than were Republicans to their party's presumptive nominee -- again, the opposite trend of today's electoral situation, which shows Republicans more loyal than Democrats.
- Among Republican voters in 1996, 80% supported Dole and 9% supported Clinton.
- Among Democratic voters, 86% supported Clinton and 6% supported Dole.
- Among the 9% of likely voters who said in 1996 that they were independent and did not "lean" to either party, Clinton won by 11 percentage points -- also the opposite trend of today's polling results among independents, where Bush leads by 10 percentage points.
- All of these advantages for Clinton in 1996 translated into the 8-point lead that carried him to victory.
In short, a Gore victory in November this year will require the Vice President to change existing voting patterns to mirror the party voting tendencies that gave Clinton his win in 1996.
Q7: Why is there a gender gap? How long has it been evident in presidential elections?
When the 19th Amendment was adopted, giving women the right to vote, many feminists of the day thought that women might become an independent political force and vote quite differently from men. Initially, at least, that did not appear to be the case, although there were no scientific polls at the time to demonstrate how similar, or dissimilar, were the preferences of men and women.
Since 1980, political analysts have noted that women give proportionately more support to Democratic presidential candidates than do men -- and, of course, that men give proportionately more support to Republican candidates than do women. This is the famous "gender gap" to which observers refer in the current political environment. However, as shown in the chart below, the gender gap has varied both in size and direction over the past half century. (For purposes of clarity, support just for the Democratic candidate is plotted; support for the Republican candidate forms essentially a mirror image of the plot below.)
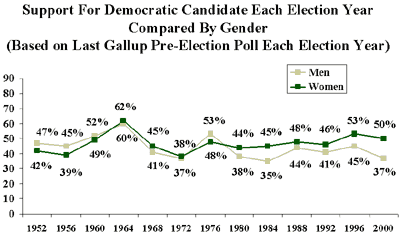
Some major conclusions from an analysis of these trends over the past half century:
- Except for this year, the gender gap each year has been smaller than 10 percentage points.
- In the two elections pitting Republican candidate Dwight D. Eisenhower against Democratic candidate Adlai Stevenson (1952, 1956), women actually gave greater support (5 to 6 percentage points) to the Republican than the Democratic candidate.
- Again, in 1976, when Democrat Jimmy Carter ran against Republican Gerald Ford, women gave greater support to the Republican than to the Democratic candidate (5 percentage points).
- From 1980 to 1996, there has been a consistent, albeit modest gender gap, with women regularly giving more support than do men to the Democratic candidates.
- Gallup polls so far this year show a 13% point gap between women and men in their support for Democrat Al Gore
- If the current results hold up on Election Day, this year may produce the largest gender gap of the past fifty years.
Party Identification and Gender Gap
One way to better understand the gender gap in presidential preference is to note that there is also a gender gap in party identification, with women more likely than men to choose the Democratic Party, and men more likely than women to choose the GOP.
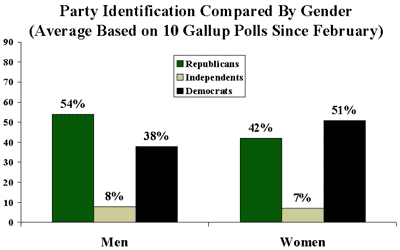
Among likely voters:
- Men choose the GOP by a margin of 54% to 38%.
- Women choose the Democratic Party by a margin of 51% to 42%.
- About an equal number of men (8%) and women (7%) say they are independent and do not lean to either party.
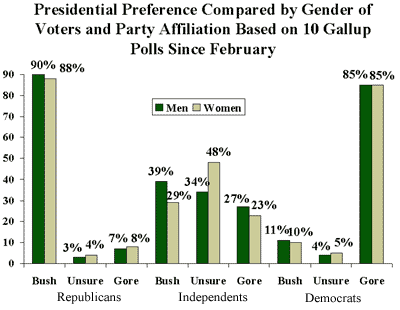
These results suggest that the gender gap in presidential preference is, to a significant degree, a gender gap in party identification.The next chart (below) illustrates that point.
- Among Republican likely voters, there is no gender gap in presidential preference: men prefer Bush by 90% to 7%, women by 88% to 8%.
- Among Democratic likely voters, there is no gender gap in presidential preference: women prefer Gore by 85% to 10%, men by 85% to 11%.
- These results show that although women are more likely to choose the Democratic Party and men the Republican Party, once they have chosen a party, voters of both genders exhibit equal loyalty to their respective party's presumptive nominee.
- The chart also shows that there is a modest gender gap among
the 7-8% of likely voters who consider themselves non-leaning
independents -- but the gap is mostly one where women are more
likely than men to beunsureabout their presidential
preference.
- Male independents express more support for Bush than do female independents by 39% to 29%, a 10-point gap.
- Male independentsalsoexpress more support for Gore than do female independents, by 27% to 23%, a 4-point gap.
- Female independents express moreuncertaintyabout their vote choice than do male independents, by 48% to 34%, a 14-point gap.
GALLUP NEWS SERVICE
Q8: What is the overall mood of the electorate and how does it compare to previous elections?
If Al Gore were the incumbent president this year running for re-election, he would most likely be the strong favorite to be re-elected. Public satisfaction with the direction of the country is widespread, confidence in the economy is extremely high --as is confidence in personal finances -- and no single issue or problem is weighing on the minds of Americans.
Shortly after the 1996 election in which Bill Clinton won a second term, the Gallup Poll editors wrote: "If the question in this year’s presidential race was ‘Why re-elect Bill Clinton?’ Americans’ answer seems to have been, ‘Why not?’’ At the time, every major indictor of the public’s mood showed high levels of contentment -- if not in an absolute sense, than certainly relative to previous election years. All of these indicators are even more positive today than they were in 1996, making America’s collective mood entering Election 2000 perhaps the jolliest on record.
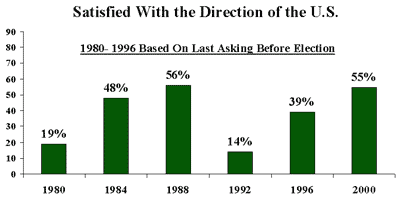
Since 1979, when Gallup first asked Americans whether or not they were "satisfied or dissatisfied with the way things are going in the U.S.," there have been five presidential elections. In each case, the success of the incumbent president or sitting vice president seeking election seemed to correlate with the extent of public satisfaction with the state of the nation.
In 1980 and 1992, public satisfaction was extremely low -- falling below 20%. And in both cases the incumbent president seeking reelection lost: Carter in 1980 and Bush in 1992. In 1984 and 1996, public satisfaction with the country was higher, but still under the 50% mark. Nevertheless, the sitting presidents in those years handily won reelection (Reagan in 1984 and Clinton in 1996). In 1988, the year sitting Vice President George Bush ran for president, public satisfaction was over 50%, and Bush won. Satisfaction scores this year are similar to 1988.
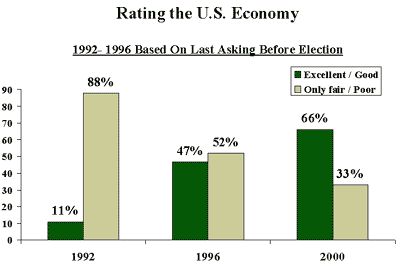
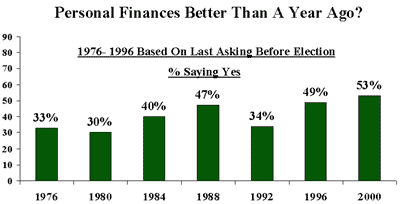
(Note that all trends in the charts below are based on the pre-election survey conducted closest to November for each year. Year 2000 trends are based on most recent asking.)
Since 1992 Gallup has tracked public confidence in the economy by asking respondents to rate current economic conditions on a four-point scale, as either excellent, good, only fair or poor. The public's assessment today is extraordinarily positive relative to 1992 -- the year George Bush lost the presidency. It is even higher today than it was in 1996 when Americans returned Bill Clinton to the White House.
Americans’ current assessment of their own wallet is also highly positive, with 53% now saying they are better off financially today than they were a year ago. This is roughly comparable to what Gallup found before the 1996 election, but far exceeds that found during other times of economic prosperity, such as 1984 and 1988.
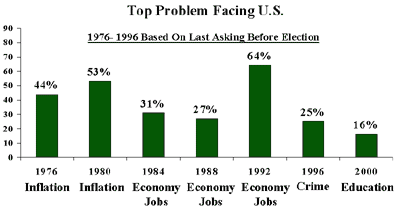
One important indication of voter contentment comes from Americans’ answers to the question "What is the most important problem facing the country today?" This year, as in 1996, 1988 and 1984, public concern is dispersed across a wide array of issues, with no single issue or problem dominating the minds of Americans. Today the top problem mentioned is education and ethics/moral values rank a close second. However the percentage naming either of these problems falls short of 20%. By contrast, in years when incumbent president were removed from office, close to half, if not more, of Americans identified a particular issue -- such as inflation in 1980 and the economy in 1992.
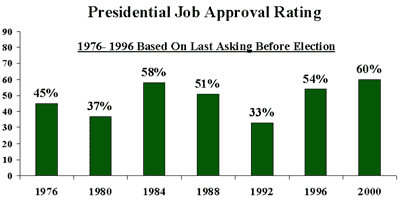
Finally, one can use Americans’ evaluations of the job performance of the sitting president as an indication of general satisfaction. This year, as in 1984, 1988 and 1996, Americans solidly approve of the way the president is handling his job. High job approval ratings clearly benefited Reagan and Clinton when they sought re-election, and seemed to aid Vice President George Bush in 1988 when he asked Americans to continue the "Reagan Revolution" by electing him. With President Clinton now receiving job approval ratings at the 60% level, Gore is in a strong position to make the same argument.
The key question overall: to what extent can Vice President Gore capitalize on these positive sentiments and thus persuade voters to trust him as they would an incumbent?
GALLUP NEWS SERVICE
Q9: What is driving the presidential race at this point? On what basis are voters making their choices?
The analysis of the election in the context of voters' party affiliation showed that about eight in ten voters (81%) are choosing the candidate supported by their party. The other 19% of voters either do not identify with one of the two major parties or if they do identify as either a Republican or a Democrat, they are voting for a candidate of the opposing party.
Thus, it is clear that party affiliation does not completely explain the vote choice:
- Independents obviously have to choose on the basis of some factor other than party.
- Some party members are defecting to the other party.
To determine what factors help to explain how independents choose their candidates and why some party identifiers defect to the other party, Gallup asked voters in a recent poll to indicate which of the two major candidates could better handle eight issues, and separately to indicate which candidate was better described by eight positive personal characteristics.
For the most part, voters picked the candidates that corresponded to their initial vote choice, so all of the evaluations correlate highly with presidential vote. Still, the scores the candidates received varied among the 16 items, and these variations provide a useful insight into what factors are "driving" the election at this point in the campaign. A special statistical analysis of the responses allows each item to be rank ordered according to its importance in explaining the current presidential vote. The results are shown in the graph below.
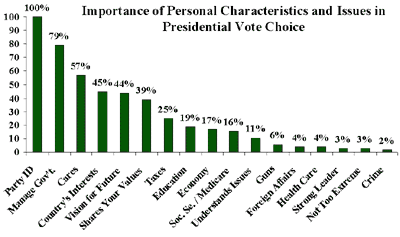
Note that party identification is the best overall factor for understanding the election, and thus receives a score of 100. Other results are as follows:
- The second most important factor is voters' perceptions of a personal characteristic of the candidates -- who can better manage government effectively. In the statistical analysis, this dimension was 79% as strong as party identification in predicting voters' preferences.
- The third ranked factor, with a score of 57, is whether a candidate is perceived as one who "cares about the needs of people like you."
- The fourth, fifth and sixth ranked factors also deal with voters' perceptions of personal characteristics: between the two candidates, who is better described as putting the country's interests ahead of his own, having a vision for the country's future, and sharing the values of the voters?
- Apart from party identification, the most importantissueexplaining the current distribution of voter preferences is "taxes". Note that this issue is only 25% as strong a factor in predicting vote choice as is party affiliation, and that it follows five items that are best characterized as personal characteristics of the candidates rather than as issue positions.
- Note also those three additional issues -- education, the economy and Social Security/Medicare -- all share a similar level of importance, with scores between 16 and 19.
For each of the personal characteristics, respondents were asked whether Bush or Gore was better described by that characteristic. For each issue position, voters were asked whether Bush or Gore could handle that issue better. Thus, we can say what percent of voters favored Bush and what percent favored Gore on each of the 16 items. Those results are shown in the table below, along with the importance score (as described above) and with the net advantage to Gore or Bush.
|
Importance of Personal Characteristics
and Issues |
||||
|
Importance |
Favors |
Favors |
Advantage |
|
|
Party Identification |
100 |
48 |
46 |
2 |
|
Manage government effectively (9D) |
79 |
43 |
40 |
3 |
|
Cares about needs of people like you (9B) |
57 |
39 |
42 |
-3 |
|
Puts country ahead of own interests (9E) |
45 |
37 |
37 |
0 |
|
Vision for future (9H) |
44 |
42 |
38 |
4 |
|
Shares your values (9A) |
39 |
43 |
40 |
3 |
|
Taxes (10F) |
25 |
47 |
38 |
9 |
|
Education (10D) |
19 |
41 |
46 |
-5 |
|
Economy (10A) |
17 |
43 |
44 |
-1 |
|
SS and Medicare (10G) |
16 |
41 |
46 |
-5 |
|
Understands complex issues (9F) |
11 |
36 |
41 |
-5 |
|
Gun issue (10C) |
6 |
43 |
37 |
6 |
|
Foreign Affairs (10B) |
4 |
43 |
42 |
1 |
|
Health care (10H) |
4 |
37 |
49 |
-12 |
|
Strong and decisive leader (9C) |
3 |
50 |
30 |
20 |
|
Not too extreme (9G) |
3 |
38 |
43 |
-5 |
|
Crime (10E) |
2 |
52 |
32 |
20 |
Party identification was deemed to "favor" Bush, because in this poll, 48% of likely voters were Republicans and 46% were Democrats. (The average over the past four months has been 48% to 45%.)
- 43% of likely voters chose Bush as the candidate who can better manage government effectively, compared to 40% who chose Gore -- a net advantage to Bush of 3 percentage points.
- Similarly, other issues at the top of the list (they are rank- ordered by "importance" in explaining the vote) show very little differences between the candidates -- a reflection of the fact that the presidential race is very close.
- The only double-digit differences are health care (where Gore wins by 12 points), strong and decisive leader (where Bush wins by 20 points) and crime (Bush also the winner by 20 points).However, all of these items are of relatively low importance -- with importance scores of less than five.This means that compared to party affiliation, these three items are less than 5% as strong in predicting how people vote.
Party Identification is Related to Issues
While party identification is the most important "driver" of the presidential vote, as it is in most elections, that fact does not mean that issues are not important. Gallup polls show major differences between Republicans and Democrats on most issues, differences that are generally magnified among political representatives of each party. Thus, to choose a party is also to make a decision about issues in general -- since on most major issues, Republican representatives tend to be conservative and Democratic representatives tend to be liberal.
Still, the analysis here shows that while most voters support the candidate of their party, some voters do not -- and for them, there are issues and personal characteristics that explain their "defections." Furthermore, the 6-8% of voters who consider themselves independent (and do not lean to either party) also rely on the issues and characteristics to make a decision. This analysis shows which of those items are most important -- beyond party affiliation.
For now, it is the perceived personal characteristics of the candidates, rather than how the candidates might handle issues, that are more likely to pull some Democrats away from Gore and some Republicans away from Bush, and also help independents decide which of the two candidates to support. As the campaign progresses, and voters become more aware of the issue differences among the candidates, it could well be that the issues will become more important than they are now in explaining the vote.
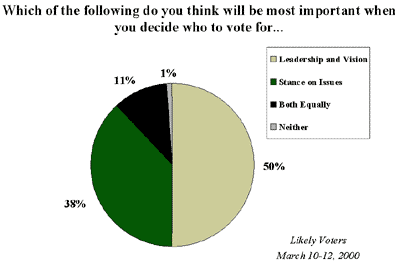
There is some additional data that bear on the question of the importance of issues in the election. In a March 10 poll, Gallup asked Americans if the candidates’ positions on certain issues or their leadership skills and vision were more important in helping decide their vote. A greater proportion of likely voters mentioned leadership skills and vision (50%), but a significant number mentioned issues (38%). In fact, several other polls this year show very similar results. Thus, even if issues will not be the dominant factor in determining the ultimate election outcome, they will help to shape the campaign.
GALLUP NEWS SERVICE
Q10: Even if issues are not of paramount importance at this point in the election, what are the concerns that Americans would most like to have addressed in the campaign?
One way to assess the issues that have the highest probability of mattering in this year’s election is to ask voters about their concerns directly. Over the course of the last several months, the Gallup poll has included questions that ask Americans a series of questions about their problems and concerns -- at the national level, the local community level, and in their own personal life. The tables that follow summarize the American public’s responses to each of these questions:
|
What is the most important problem facing the country today? March 10-12, 2000 Gallup Poll |
|
|
% |
|
|
Education |
16 |
|
Ethics/Morals |
15 |
|
Crime/Violence |
13 |
|
Taxes |
11 |
|
Dissatisfied with Government |
11 |
|
Medicare/Social Security |
9 |
|
Health Care |
8 |
|
Poverty |
5 |
|
Drugs |
5 |
|
Federal Budget Deficit/Debt |
4 |
|
International Problems/Foreign Affairs |
4 |
|
Race Relations |
4 |
|
Availability of Guns |
4 |
|
Welfare |
3 |
|
Military/Defense |
3 |
|
What is the number one problem that faces your local community today? May 23-24, 2000 Gallup Poll |
|
|
% |
|
|
Education/Schools |
17 |
|
Crime |
12 |
|
Drugs/Alcohol |
10 |
|
Taxes |
5 |
|
Overcrowding/Growth |
4 |
|
Unemployment |
4 |
|
Decline in Morals |
3 |
|
Health Care Issues |
3 |
|
What is the biggest challenge you face in your daily life today? March 30-April 2, 2000 |
|
|
% |
|
|
Economic/Financial/Cost of Living |
21 |
|
Taking Care of Children/Family |
11 |
|
Keeping Job/Work, Career |
7 |
|
Health/Staying Healthy |
6 |
|
Education/Getting Through School |
5 |
|
Getting Motivated to Get Out of Bed |
3 |
|
Getting Through the Day |
3 |
|
Single Parent/Living Alone |
2 |
|
Finding a Job/Unemployed |
2 |
|
Having Enough Money for Retirement |
2 |
|
High Taxes |
2 |
|
Lack of Time |
2 |
|
Survival |
2 |
|
Aging |
2 |
|
Spirituality |
2 |
|
Balancing Work and Family |
2 |
|
Maintaining Social Security |
2 |
Even though the economy is not the urgent concern this year that it has been in the past, it is apparent that there is perhaps an inevitable undercurrent of worry about economic issues that will always be a part of a presidential campaign. As noted above, Americans express concern about economic matters at both the national and personal level. In fact, combining the categories of responses, the analysis shows that economic issues are the number one broad category of problems facing the country today, and that economic concerns are the primary category of concerns facing Americans as they go about their daily lives.
A second issue of apparent concern this year will be education -- the top single problem facing the nation according to Americans, as well as one of the top issues facing respondents’ local communities. And, although it is lower on the list, getting an education for either themselves or for their children is on the list of the top worries and concerns Americans say they face as they go about their daily lives. Thus, any candidate who addresses education will, at least on the face of it, be tapping into a very significant element of voter concern this year.
A third issue revolves around a complex of concerns relating to crime. Although crime rates are down nationally and, according to Gallup polling, crime is no longer at the top of the list of problems facing the nation as a whole, crime, drugs and alcohol, taken together, are mentioned by more Americans than any other kind of problems in their local community. Crime concerns are also, it should be noted, related to such high profile issues as gun control and the death penalty.
A fourth broad concern of Americans is health. Health care is among the top concerns facing the nation as a whole, according to Gallup polling, and health is one of the issues Americans say is of great concern to them personally on a daily basis. In fact, an analysis of the concerns people mention facing them in their daily lives shows that the salience of health issues increases significantly with age, becoming one of the dominant concerns -- if not the single most dominant -- among Americans 65 years of age and older. Health issues lead to concerns about such issues as Medicare and HMO reform, among others.
A final dimension that is of apparent concern to Americans revolves around a broader, more diffuse focus on morality and family values. This is most apparent when Americans talk about the number one problem facing the country today, where "ethics and morality" is the second most frequently mentioned category. Perhaps related to this is the fact that a number of Americans -- in one way or the other -- talk about a need for personal meaning in their own lives as their most pressing daily concern.
Conspicuously absent from the list of concerns facing the American voter going into this presidential election is any major concern about war or other foreign policy on the national scene (as opposed to previous years such as 1952, 1968, 1972 and 1980 when foreign affairs was a primary focus of presidential campaigns). Also absent from highly prevalent concerns are such "single issues" as abortion, although it may be indirectly related to the broad categories discussed above.
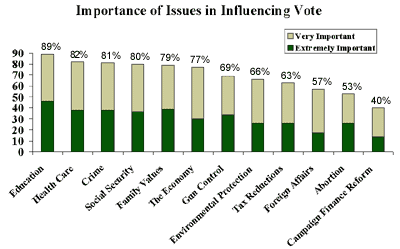
An alternative way to gauge the importance of issues in an election is simply to ask people to rate how important a series of issues will be in influencing their vote for president this November. In a poll conducted April 3-9, 2000, Americans rated 12 such issues.
- Education was said to be either "extremely" or "very" important by 89% of Americans.
- The next most important set of issues were Health Care (82% said it was important), Crime (81%), Social Security (80%), and Family Values (79%).
- Campaign Finance Reform (40% indicated it was important) and Abortion (53%) were the least important issues, according to the poll.
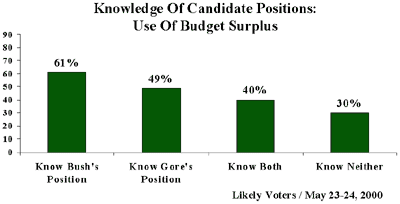
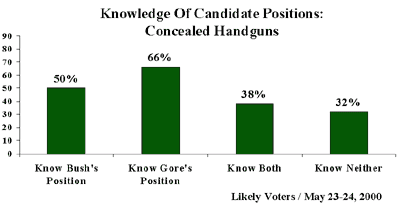
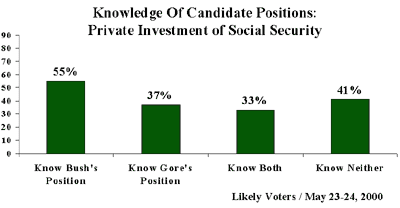
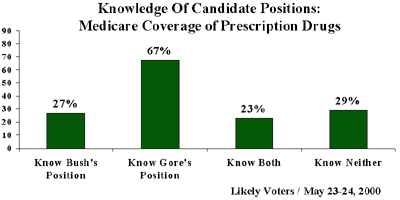
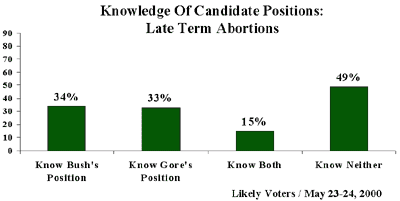
To date, both candidates have made extensive efforts to spell out specific proposals to deal with issues facing the nation. There is evidence that the voters are listening to some degree, though in many cases the majority of likely voters are not aware of wherebothGeorge W. Bush and Al Gore stand on a particular issue. In a poll conducted May 23-24, Gallup asked Americans to identify what side of an issue each candidate fell on, from among those that one of the candidates had made a specific position. The results show:
- A majority of likely voters knew at least one of the
candidates’ position on 4 of the 5 issues. In most cases,
this reflects the candidate who has spoken most prominently on the
issue.
- 61% knew that Bush preferred to use the budget surplus on a tax cut, while 49% knew Gore preferred to spend it on paying down the federal debt.
- 66% knew that Gore opposed laws that allowed citizens to carry concealed handguns, while 50% knew Bush supported them.
- 55% knew that Bush wanted to allow younger workers the option of investing part of their Social Security withholdings in private investment plans, while 37% knew Gore opposed the idea.
- 67% knew that Gore favored expanding Medicare to cover the costs of prescription drugs, while 27% knew Bush opposed it.
- Only 33% knew that Gore opposed a ban on partial-birth abortions and just 34% knew Bush favored such a ban.
- At best, only 40% of likely voters could correctly identify
wherebothGore and Bush stood on any issue.
- Voters were most likely to know how where each candidate stood on spending the budget surplus, as 40% could correctly identify both the Gore and Bush positions.
- Slightly fewer respondents (38%) knew both candidates’ positions on concealed handgun laws.
- One in three voters knew where both candidates stood on allowing private investment of Social Security funds.
- Relatively few Americans know where both candidates stand on Medicare coverage of prescription drugs (23%) and banning partial-birth abortions (15%).
- In no case did a majority of likely voters fail to correctly
identify at least one of the candidates’ positions on an
issue.
- Slightly less than half (49%) of likely voters did not know either Bush’s or Gore’s position on late-term abortions. Private investment of Social Security was voters’ next toughest challenge, as 41% could not name either candidate’s position on the issue.
These results are somewhat inconclusive in helping us understand the potential for issues to influence the election outcome. Certainly, a voter must know where at least one of the candidates, and preferably both, stand on an issue for it to affect his or her vote. However, we know that the campaign is still in the early stages and many Americans are not tuning into the specifics of the debate just yet. Still, the results do show that some education about the issues has already taken place in the electorate, and presumably there will be more to come.
*Less than 0.5%