GALLUP NEWS SERVICE
PRINCETON, NJ -- Gallup's annual October Gallup Poll Social Series update on Americans' attitudes toward crime shows no diminution in Americans' strong support for the death penalty in cases of murder.
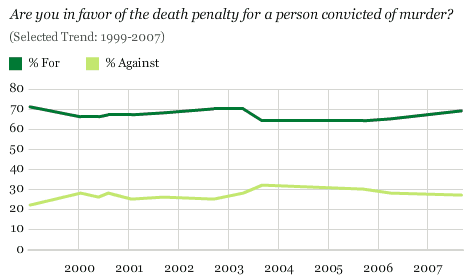
The Oct. 4-7 poll indicates that 69% of Americans respond "yes" when asked this question: "Are you in favor of the death penalty for a person convicted of murder?" This level of support for the death penalty is generally in line with the level of support that Gallup has measured in 13 polls featuring this question since 1999.

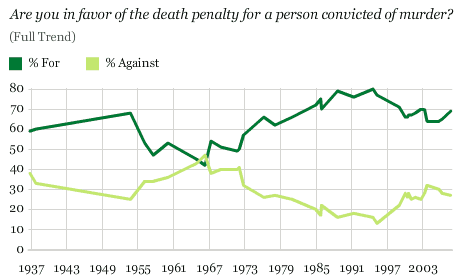
Prior to 1999, support for the death penalty, based on Gallup Poll responses to this question -- which was first asked in the 1930s -- waxed and waned over the years:

When Gallup asked Americans about the death penalty in cases of murder more than 70 years ago in 1936, 59% supported it. Support dropped below 50% at several points in the 1950s, 1960s, and in 1971, although with relatively large "don't knows." There has been only one Gallup Poll -- conducted in May 1966 -- showing greater opposition than support for the death penalty. That poll came as the country was debating the constitutionality of the death penalty and culminated in the Supreme Court's ruling several state death penalty laws unconstitutional. However, the death penalty returned in the mid-1970s as newly written state laws passed constitutional muster, and the percentage of Americans in favor of the death penalty rose again to the 60% and 70% range. The all-time high point for support for the death penalty was 80%, measured in 1994.
There are a number of different ways to gauge public attitudes about the use of the death penalty in the United States. The basic favor/oppose question has the great advantage of having been trended back to the 1930s, as noted, and has varied significantly over the years.
A different question that Gallup uses from time to time, however, finds a lower level of support for the death penalty. This question provides the respondent with an explicit alternative to the death penalty: "life imprisonment, with absolutely no possibility of parole." This question was not asked this year, but support for the death penalty typically has registered in the 47% to 54% range when this alternative has been included in the question this decade.
If you could choose between the following two approaches, which do you think is the better penalty for murder -- [ROTATED: the death penalty (or) life imprisonment, with absolutely no possibility of parole]?
|
The death |
Life |
No |
|
|
% |
% |
% |
|
|
2006 May 5-7 ^ |
47 |
48 |
5 |
|
2001 Feb 19-21 ^ |
54 |
42 |
4 |
|
2000 Aug 29-Sep 5 ^ |
49 |
47 |
4 |
|
2000 Feb 20-21 |
52 |
37 |
11 |
|
1999 Feb 8-9 ^ |
56 |
38 |
6 |
|
1997 Aug 12-13 ^ |
61 |
29 |
10 |
|
1993 Oct 13-18 |
59 |
29 |
12 |
|
1992 Mar 30-Apr 5 |
50 |
37 |
13 |
|
1991 Jun 13-16 |
53 |
35 |
11 |
|
1986 Jan 10-13 |
55 |
35 |
10 |
|
1985 Jan 11-14 |
56 |
34 |
10 |
|
^Asked of a half sample |
|||
All in all, a substantial majority of Americans support the idea of the use of the death penalty in cases of murder, but some of this support appears weak enough that it could be affected by a promise that convicted murderers would be given life imprisonment with no chance for parole. Some Americans may be skeptical that such a guarantee could ever be made ironclad, which may at least partially account for the gap between basic support for the death penalty and support in response to this hypothetical question.
Morality of the Death Penalty
Gallup's annual Values and Beliefs Survey, conducted each May, shows that 66% of Americans -- almost the same percentage that supports the death penalty -- find the death penalty "morally acceptable." Just 27% say the death penalty is morally wrong. This view of the morality of the death penalty has been relatively constant since 2001.
The death penalty
|
|
|
DEPENDS ON |
NOT A |
|
|
|
% |
% |
% |
% |
% |
|
|
2007 May 10-13 |
66 |
27 |
5 |
* |
2 |
|
|
|
|
|
|
|
|
2006 May 8-11 |
71 |
22 |
5 |
* |
2 |
|
2005 May 2-5 |
70 |
25 |
4 |
* |
1 |
|
2004 May 2-4 |
65 |
28 |
4 |
1 |
2 |
|
2003 May 5-7 |
64 |
31 |
4 |
-- |
1 |
|
2002 May 6-9 |
65 |
28 |
5 |
* |
2 |
|
2001 May 10-14 |
63 |
27 |
7 |
1 |
2 |
|
(vol.) = Volunteered response |
|||||
In short, about two-thirds of Americans support the death penalty in response to two key measures -- as an appropriate penalty for a person convicted of murder and as being morally acceptable.
Frequency of Use and Fairness of the Death Penalty
Not only do Americans support the death penalty in concept, but only a minority of about one in five says the death penalty is imposed too often. About half say that it is not imposed often enough, while the rest say it is imposed about the right amount. These perceptions have been roughly constant since 2002. In a May 2001 survey, however, the percentage saying the death penalty was not imposed often enough was lower, at 38%.
In your opinion, is the death penalty imposed -- [ROTATED: too often, about the right amount,
or not often enough]?
|
Too |
About the |
Not |
No |
|
|
% |
% |
% |
% |
|
|
2007 Oct 4-7 |
21 |
26 |
49 |
4 |
|
|
|
|
|
|
|
2006 May 8-11 |
21 |
25 |
51 |
3 |
|
2005 May 2-5 |
20 |
24 |
53 |
3 |
|
2004 May 2-4 |
23 |
25 |
48 |
4 |
|
2003 May 5-7 |
23 |
26 |
48 |
3 |
|
2002 May 6-9 |
22 |
24 |
47 |
7 |
|
2001 May 10-14 |
21 |
34 |
38 |
7 |
A good part of the criticism of the death penalty in recent years has focused on allegations that it is imposed unfairly. DNA evidence has shown that some people on death row were actually not guilty of the crimes for which they were convicted, and critics argue that people belonging to certain subgroups of the population -- including minorities -- are disproportionately likely to receive the death penalty and to be executed than are others.
But only 38% of Americans believe that the death penalty is applied unfairly in this country today. A majority of 57% say that it is not. Americans have actually become slightly more likely to say the death penalty is applied fairly in the last several years, compared with results from polls conducted in 2000 and 2002, during the height of publicity surrounding state moratoriums on the death penalty.
Generally speaking, do you believe the death penalty is applied fairly or unfairly
in this country today?
|
Fairly |
Un- |
No |
|
|
% |
% |
% |
|
|
2007 Oct 4-7 |
57 |
38 |
5 |
|
|
|
|
|
|
2006 May 8-11 |
60 |
35 |
4 |
|
2005 May 2-5 |
61 |
35 |
4 |
|
2004 May 2-4 |
55 |
39 |
6 |
|
2003 May 5-7 |
60 |
37 |
3 |
|
2002 May 6-9 |
53 |
40 |
7 |
|
2000 Jun 23-25 |
51 |
41 |
8 |
Support by Subgroups
Support for the death penalty varies some within different subgroups of the American population, but perhaps not as much as might be expected.
|
Are you in favor of the death penalty for a person convicted |
||
|
|
Favor |
Oppose |
|
|
% |
% |
|
Conservative |
81 |
16 |
|
Republican |
81 |
16 |
|
50+ male |
78 |
18 |
|
Male |
76 |
20 |
|
18-49 Male |
74 |
22 |
|
West |
73 |
25 |
|
Some college |
73 |
22 |
|
White |
73 |
23 |
|
Midwest |
72 |
24 |
|
High school or less |
72 |
23 |
|
SAMPLE AVERAGE |
69 |
27 |
|
Total college |
67 |
29 |
|
Independent |
67 |
28 |
|
East |
66 |
30 |
|
South |
66 |
29 |
|
College grad |
66 |
30 |
|
50+ female |
66 |
30 |
|
Moderate |
64 |
32 |
|
Female |
62 |
33 |
|
18-49 female |
60 |
37 |
|
Democrat |
60 |
35 |
|
Liberal |
59 |
36 |
|
Postgrad |
57 |
41 |
|
Nonwhite |
55 |
41 |
Only two groups are more than 10 points above the sample average in terms of their support -- conservatives and Republicans. Only three groups are less likely by 10 points or more than the sample average to support the death penalty -- liberals, those with postgraduate education, and nonwhites.
The sample size of blacks in this one survey is too small to provide reliable estimates of the attitudes of this group, but a detailed analysis by Gallup's Lydia Saad in late July (see Related Items) showed that blacks are less likely to support the death penalty than are whites by about 30 percentage points, and that blacks have consistently over the years been significantly less likely to support the death penalty than have whites.
Also of note in the current survey is that men are generally more supportive of the death penalty than are women.
Survey Methods
Results are based on telephone interviews with 1,010 national adults, aged 18 and older, conducted Oct. 4-7, 2007. For results based on the total sample of national adults, one can say with 95% confidence that the maximum margin of sampling error is ±3 percentage points.
In addition to sampling error, question wording and practical difficulties in conducting surveys can introduce error or bias into the findings of public opinion polls.
