Most Americans rate their current personal lives fairly positively. They tend to believe that their present situations are better than their past, and when looking ahead five years, they tend to believe their lives will get even better in the future.
These are some of the major findings of Gallup's annual "striving scale" measurement -- a time-honored method of assessing the quality of life experienced by Americans. Using an 11-point scale, where zero is "the worst possible life" and 10 is "the best possible life," most Americans use the positive end of the scale (scores from 6 to 10) to rate their current situations.
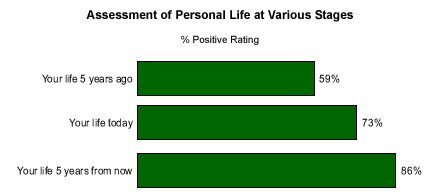
According to Gallup's annual Mood of the Nation survey, conducted Jan. 12-15, only 59% of Americans think their lives five years ago rated a 6 to 10 on the scale, compared with 73% who rate their current lives at this level, and 86% who forecast their lives will be this positive five years from now.
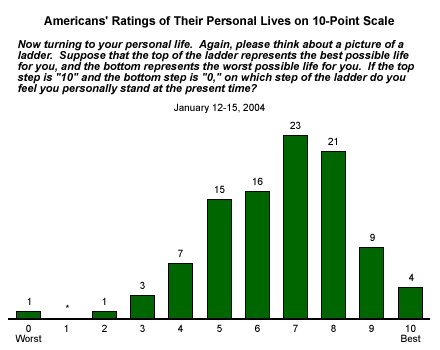
Princeton University psychologist Dr. Hadley Cantril, the originator of this method of gauging people's sense of personal well-being [in the 1950s], called it "a self-anchoring striving scale." It was used in two important studies of public opinion in the 1960s and 1970s (one by the Institute for International Social Research and the other by Potomac Associates). More recently, The Gallup Poll has relied on the measure in several of its own surveys.
The latest results show little change in these perceptions in recent years. Seventy-three percent of Americans assess their current personal situations in positive terms -- giving a rating of 6 through 10 -- with most of these giving a rating of 6, 7, or 8.
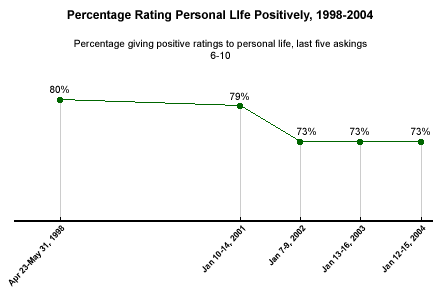
In fact, in each of the last three years, exactly 73% of Americans have rated their personal situations positively. There has been some drop-off in personal situation ratings in the post-Sept. 11 world, as two pre-9/11 polls (one conducted in 1998 and another in January 2001) showed about 80% of Americans rating their lives positively.
Present Versus Past and Future
The typical pattern of responses to the "striving scale" is for Americans to rate their current standings more positively than their past standings, but less positively than their future standings.
The proportion rating their current lives positively tends to be about 15 percentage points greater than the proportion rating their past situations (five years ago) positively. And the percentage giving positive ratings for their future situations is about 10 points higher than the percentage giving positive ratings of their current situations. Over the past five years, Gallup's 1998 survey is the one exception to these average gaps in ratings. At that time, respondents were much more positive about the present compared with the past (+30 points), and were relatively subdued in their expectations for the future compared with the present (+6 points).
Comparison of Present, Past and Future Assessments of Personal Lives
|
Year |
Positive Rating, |
Positive Rating, |
Positive Rating, |
|
|
|
|
|
|
2004 |
73% |
59% |
86% |
|
2003 |
73% |
61% |
85% |
|
2002 |
73% |
61% |
86% |
|
2001 |
79% |
55% |
90% |
|
1998 |
80% |
50% |
86% |
|
|
|
|
|
|
Average |
76% |
57% |
87% |
Gallup Polls typically show Americans tend to be more optimistic than pessimistic about the future, especially when their own personal situations are involved. However, this optimism may be somewhat misplaced, especially when considering how their ratings of their situations in five years compare with their ratings of the present after those five years have passed.
For example, In 1998, 86% gave a positive evaluation of their expected situations five years down the road. But five years later (in 2003), only 73% gave their current situations a positive rating. Despite their optimism about the future, Americans' current situation ratings in 2003 (73%) were actually less positive than their current situation ratings in 1998 (80%). This pattern has been repeated historically.
Comparisons of Expectations and Reality in Personal Situation Ratings
|
Comparison Years |
Rating of Expected |
Rating of Current |
Difference in |
|
|
|
|
|
|
1998-2003 |
1998 (86%) |
2003 (73%) |
-13 |
|
1979-1985 |
1979 (75%) |
1985 (67%) |
-8 |
|
1974-1979** |
1974 (73%) |
1979 (65%) |
-8 |
|
1971-1976** |
1971 (70%) |
1976 (68%) |
-2 |
So despite Americans' high hopes for the future, in most cases the future ends up looking very much like the present when it arrives.
On the other hand, Americans' views of the past grow increasingly negative as time goes by. Eighty percent of Americans gave a positive rating of their current situations in 1998. But when asked in the 2003 and 2004 polls about their situations five years ago, only about 6 in 10 Americans perceived their situations five years before in positive terms.
Comparisons of Expectations and Reality in Personal Situation Ratings
|
Comparison Years |
Rating of Current |
Rating of Personal |
Difference in |
|
|
|
|
|
|
1998-2003 |
1998 (80%) |
2003 (61%) |
+19 |
|
1979-1985 |
1979 (65%) |
1985 (52%) |
+13 |
|
1974-1979** |
1974 (64%) |
1979 (52%) |
+12 |
|
1971-1976** |
1971 (64%) |
1976 (51%) |
+13 |
Taken together, Americans generally believe the present is better than the past (though there have been a few exceptions to this) and that the future will be better than the present. These general notions -- far more than their accurate recollections of what the past was like or their accurate predictions about what the future will be like -- are what likely guide their thought processes when they are asked to assess their personal situations.
Additional findings of interest in this year's striving scale results:
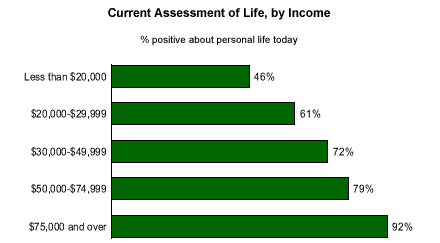
- Ratings are highly influenced by respondents' socioeconomic status, with those having higher incomes and higher levels of education much more likely to rate their current situations positively. For instance, the percentage rating their current lives between 6 and 10 on the scale rises from just 46% among the lowest-income households, to 92% among those making $75,000 or more.
- Younger Americans are more likely than older Americans to give negative ratings to their past situations, probably because their income situations have improved significantly in that time span, while older, more established people have not experienced much change in their financial situations. Only 49% of 18- to 29-year-olds say their lives five years ago rated a 6 to 10 on the scale, versus 52% of those aged 30 to 49, 69% of those 50 to 64, and 74% of those 65 and older.
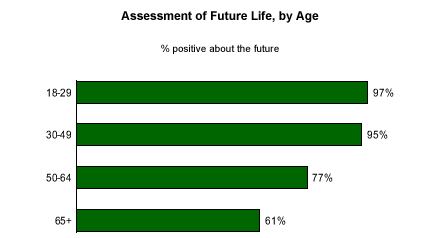
- On the other hand, older Americans are not nearly as positive as younger Americans are about the future. Almost all young adults, and even most of those in the 30-to-49 age bracket, believe that their lives in 2009 will rate a 6 to 10, but this declines to only 61% among seniors.
*These results are based on telephone interviews with a randomly selected national sample of 1,004 adults, 18 years and older, conducted Jan. 12-15, 2004. For results based on this sample, one can say with 95% confidence that the maximum error attributable to sampling and other random effects is ±3 percentage points. In addition to sampling error, question wording and practical difficulties in conducting surveys can introduce error or bias into the findings of public opinion polls.
**The 1976 survey was conducted by Gallup for the Institute for International Social Research. The 1971-1974 surveys were conducted by Gallup for Potomac Associates.
