GALLUP NEWS SERVICE
PRINCETON, NJ -- The latest CNN/USA Today/Gallup survey shows a dead heat between Republicans and Democrats among likely voters in the race to gain majority control of the U.S. House of Representatives. Among registered voters, however, the Democrats enjoy a slight edge, and among all Americans, the Democratic lead is even larger.
This same pattern is found on other evaluations of the two parties. Compared with the Republican Party, the Democratic Party is viewed more favorably among all adults, is chosen as the one more likely to represent the public's values, and is more likely to be seen as "mainstream" rather than "extreme." Among likely voters, however, the GOP receives the higher ratings in each of those three areas.
The poll, conducted July 30-Aug. 1, finds that 47% of likely voters say they will vote for a Republican in their congressional district, exactly the same percentage who will vote for a Democrat. Among registered voters, Democrats lead by 49% to 44%, and among all adults, Democrats lead by 50% to 42%.
For all groups of respondents, the figures represent a slight improvement for the Democrats when compared to the beginning of the year. Democrats trailed the Republicans among likely voters by five points in a poll conducted Jan. 2-5. The new figures represent a five-point swing in favor of the Democrats among likely voters, a six-point swing among registered voters, and a nine-point change among all Americans.
If the elections for Congress were being held today, which party's candidate would you vote for in your congressional district -- [ROTATE: 1) The Democratic Party's candidate or 2) The Republican Party's candidate]? As of today, do you lean more toward -- [ROTATE: 1) The Democratic Party's candidate or 2) The Republican Party's candidate]?
|
|
Democratic |
Republican |
Undecided/ |
|
|
% |
% |
% |
|
Likely Voters |
|
|
|
|
2004 Jul 30-Aug 1 |
47 |
47 |
6 |
|
|
|
|
|
|
2004 Jan 2-5 |
45 |
50 |
5 |
|
|
|
|
|
|
Registered Voters |
|
|
|
|
2004 Jul 30-Aug 1 |
49 |
44 |
7 |
|
|
|
|
|
|
2004 Jan 2-5 |
45 |
46 |
9 |
|
|
|
|
|
|
National Adults |
|
|
|
|
2004 Jul 30-Aug 1 |
50 |
42 |
8 |
|
|
|
|
|
|
2004 Jan 2-5 |
45 |
46 |
9 |
Republicans fare better among likely voters than among the other two groups, because generally speaking, Republicans are disproportionately likely to participate in the election.
The results suggest that each party would receive about the same number of votes nationally, but it is not clear how those numbers might translate into seats. In theory, one party could win 100% of the U.S. House seats by winning just 50.1% of the vote in each of the 435 congressional districts across the country. In practice, however, the aggregate vote percentage shows a rough correlation with the number of seats won by a party. Still, given the closeness of the results measured by this poll, neither party can be considered a shoo-in to win majority control in the election.
Images of the Parties
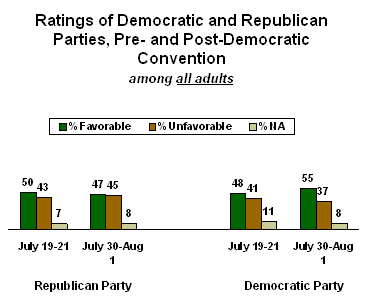
Prior to the Democratic convention (in a July 19-21 poll), the Republican Party was viewed favorably by 50% of Americans and unfavorably by 43%. The Democratic Party enjoyed a similar rating, 48% favorable to 41% unfavorable.
After the convention, the ratings were more positive for Democrats and more negative for Republicans. In the current poll, Democrats are rated favorably by a 55% to 37% margin; Republicans, by just a 47% to 45% margin.

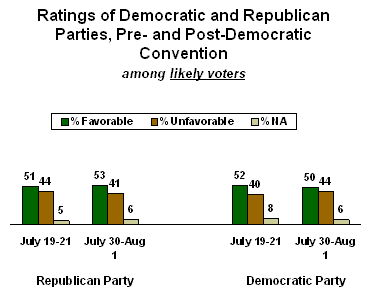
Among likely voters, the pattern is much different. Republicans went from a net favorable rating of 7 points (51% to 44%) to 12 points (53% to 41%).
Democrats, by contrast, went from a net favorable rating of 12 points (52% to 40%) to 6 points (50% to 44%). While both of these changes are not statistically significant, they are both in the opposite direction of the changes among all adults nationally, suggesting that one impact of the convention was to shift the pool of likely voters toward a more Republican orientation.

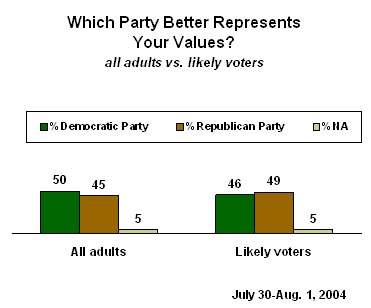
Two other measures also show the Democrats faring much better among the general public than among likely voters. When asked which party better represents their values, 50% of Americans choose the Democratic Party, 45% the Republican Party. Among likely voters, however, Republicans win by a 49% to 46% margin.

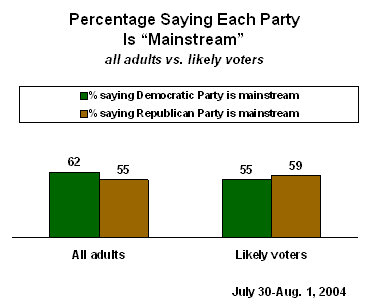
Respondents were also asked whether each party was "too extreme" or "generally mainstream." Among all adults, the Democratic Party was seen as more mainstream than extreme, by a 28-point margin (62% to 34%), while Republicans were seen as mainstream by a much smaller 15-point margin (55% to 40%).
Among likely voters, however, the Republicans enjoy an advantage. By a 21-point margin, likely voters say Republicans are mainstream (59% to 38%), while Democrats are viewed as mainstream rather than extreme by a 12-point margin (55% to 43%).

Survey Methods
Results are based on telephone interviews with 1,518 national adults, aged 18 and older, conducted July 30-Aug. 1, 2004. For results based on the total sample of national adults, one can say with 95% confidence that the margin of sampling error is ±3 percentage points.
Results based on likely voters are based on the subsample of 1,129 survey respondents deemed most likely to vote in the November 2004 general election, according to a series of questions measuring current voting intentions and past voting behavior. For results based on the total sample of likely voters, one can say with 95% confidence that the margin of sampling error is ±3 percentage points. The "likely voter" model assumes a turnout of 55% of national adults. The likely voter sample is weighted down to match this assumption.
For results based on the sample of 1,366 registered voters, the maximum margin of sampling error is ±3 percentage points.
In addition to sampling error, question wording and practical difficulties in conducting surveys can introduce error or bias into the findings of public opinion polls.